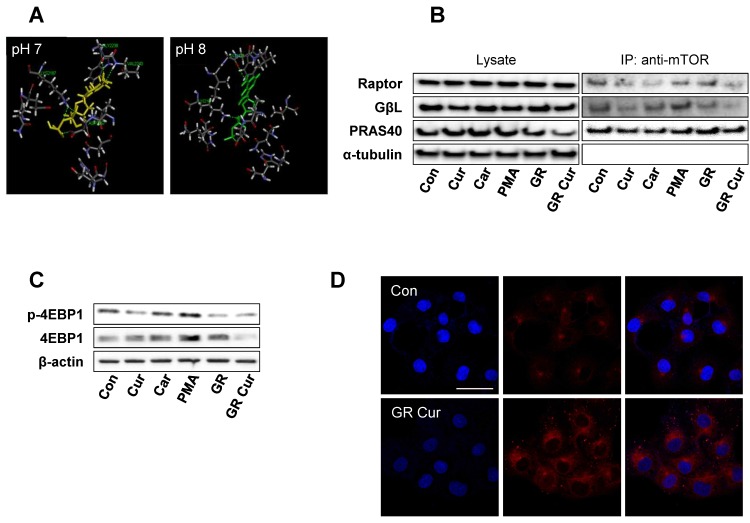
Figure 5.
pH-dependent structural changes and alteration of mTORC1 interaction degree according to pHi changes induced by curcumin and glucose restriction. (A) Structural changes of the mTOR-GβL complex at the ATP-binding site (PDB code: 4JSV) were analyzed by computational modeling using the Pipeline Pilot 8.5. In the original structure at pH 8, the activity-site cavity size is 7.08 A, whereas at pH 7, the activity-site cavity size is 8.09 A. The ATP-binding site is indicated by yellow (pH 7) and green (pH 8) solid lines, respectively. Green dashed lines indicate hydrogen bonds. The names of residues involved in hydrogen bonding are indicated. (B) Using HepG2 cells, co-immunoprecipitation was used to detect mTOR interacting proteins. The experiment was conducted three times independently. (C) For the determination of mTOR activity, the mTOR downstream signal phosphor-4EBP1 was detected by immunoblotting. β-Actin was used as a loading control. The experiment was conducted three times independently. (D) Confocal imaging of autophagosomes. Cells were immunostained with an LC3 antibody. The scale bar is 50 μm. Con, standard RPMI-1640 medium; Cur, curcumin; Car, cariporide; PMA, phorbol-12-myristate-13-acetate; GR, glucose restriction, 5.5 mM glucose medium; GR Cur, glucose restriction plus curcumin. * p < 0.05 vs. control.

