Figure 6.
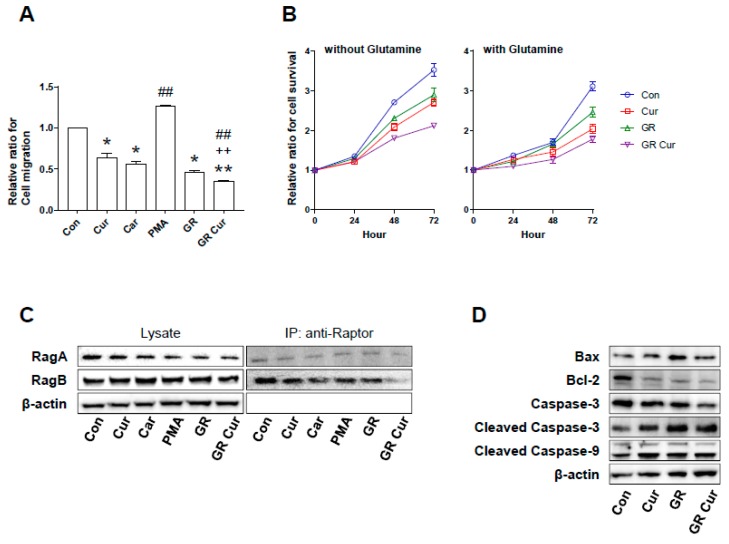
Effect of curcumin and glucose restriction on cell migration, proliferation, and death in HepG2 cells. (A) Transwell migration of HepG2 cells. Results were obtained from three independent experiments, and bar graphs represent the cell number per image field (mean ± SE). The experiment was conducted five times independently. (B) Cell proliferation rates of HepG2 cells were measured using a Cell Counting Kit-8 (CCK-8). The presence or absence of glutamine was observed. The experiment was conducted five times independently. (C) Co-immunoprecipitation was used to detect RagA and RagB. The experiment was conducted three times independently. (D) Bax, Bcl-2, Caspase-3 and -9, cleaved Caspase-3 and -9 proteins were expressed by immunoblotting. Beta actin was used as an internal control. The experiment was conducted three times independently. Con, standard RPMI-1640 medium; Cur, curcumin; Car, cariporide; PMA, phorbol-12-myristate-13-acetate; GR, glucose restriction, 5.5 mM glucose medium; GR Cur, glucose restriction plus curcumin. * p < 0.05 vs. control; ** p < 0.01 vs. control; ++ p < 0.01 vs. GR; ## p < 0.01 vs. Cur.

