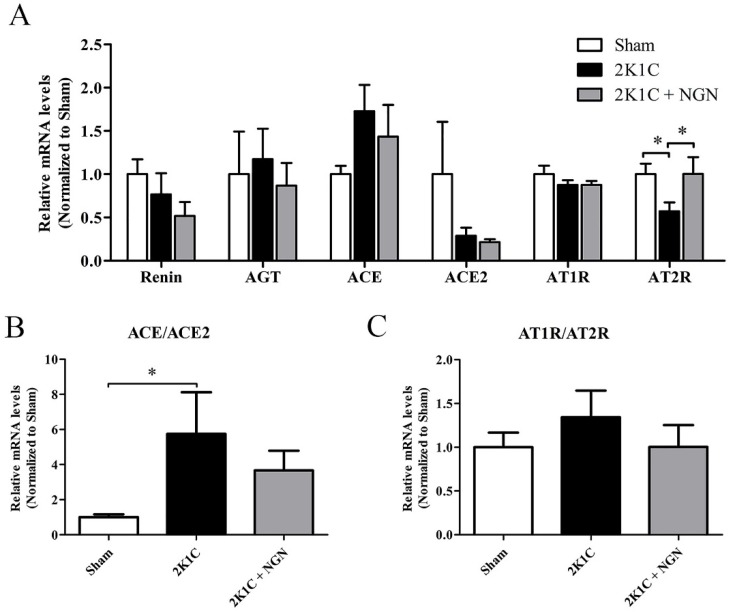
Figure 3.
Effects of naringenin on the mRNA gene expression of RAS components in 2K1C rats. (A) Relative mRNA levels of renin, AGT, ACE, ACE2, AT1R, and AT2R in nonclipped kidneys, measured by quantitative PCR. (B) Ratio of ACE/ACE2 mRNA levels. (C) AT1R/AT2R mRNA levels. n=8 in each group. The data are expressed as mean ± SEM. *p < 0.05.

