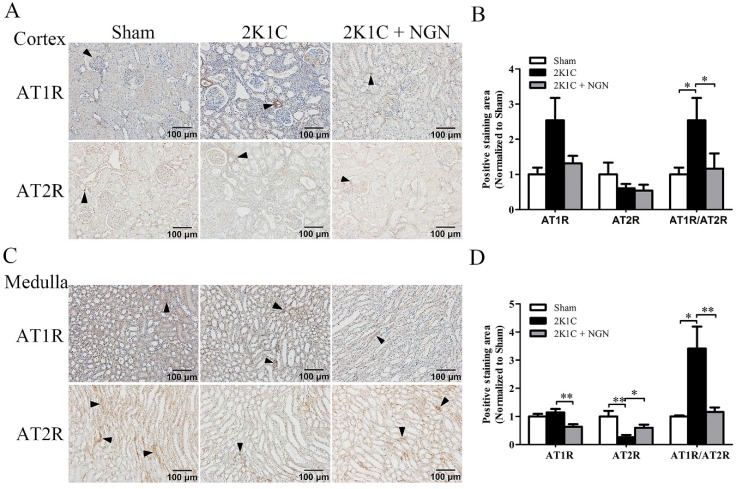
Figure 5.
Effect of naringenin on AT1R and AT2R protein expression in nonclipped kidneys in 2K1C rats. (A, B) Representative immunohistochemical staining of AT1R and AT2R and quantification in the cortex. (C, D) Representative immunohistochemical staining of AT1R and AT2R and quantification in the medulla. Scale bars = 100 μm. Black triangles indicate representative positive staining. n=8 in each group. The data are expressed as mean ± SEM. *p < 0.05, **p < 0.01.

