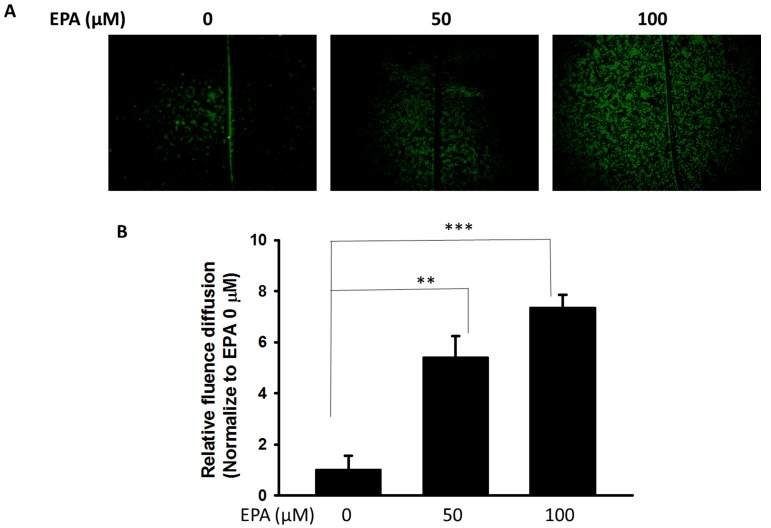
Figure 2.
EPA induced gap junction intercellular communication in B16F10 cells. (A) The B16F10 cells treated for 24 h with different concentrations of EPA were determined by scrape loading and dye transfer analysis. (B) The gap junction intercellular communication was expressed as fold of the control. (n = 6, data are mean± SD. ** P < 0.01; *** P < 0.001).

