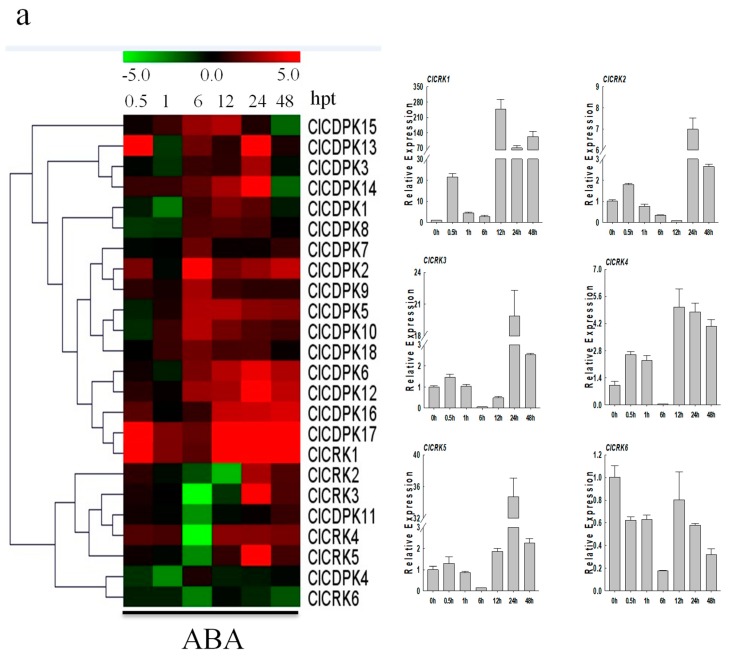
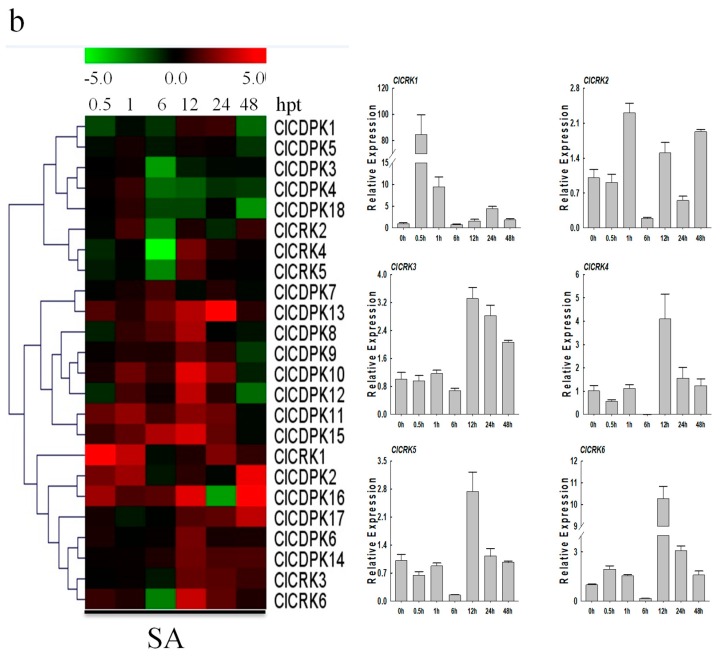
Figure 7.
Expression patterns of ClCDPK and ClCRK genes under ABA and SA hormone treatments. (a) Expression levels of ClCDPKs and ClCRKs under ABA stress visualized as a heat map (Left). Detailed expression patterns of ClCRKs under ABA stress (Right). (b) Expressions of ClCDPKs and ClCRKs under SA stress visualized as a heat map (Left). Detailed expression patterns of ClCRKs under SA stress (Right). The relative transcript level was log2 transformed and visualized as a heat map via Mev4.8.1, using red to indicate increased expression level and green to indicate decreased expression level.


