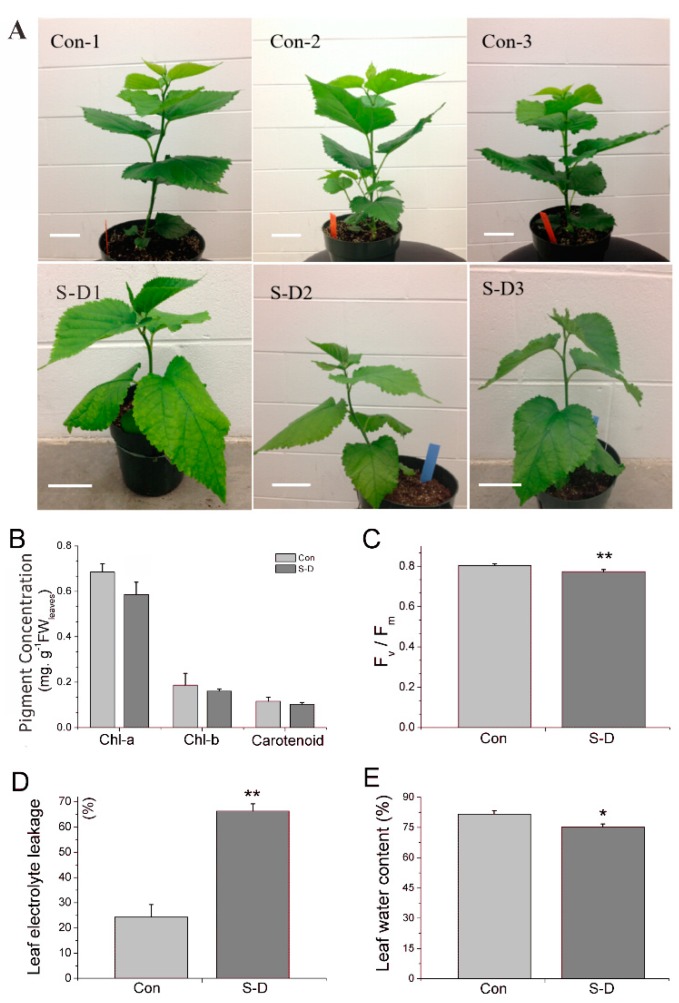
Figure 1.
Physiological responses of mulberry to a combination of salt and drought stress. (A) Growth phenotype of mulberry seedlings at the end of a combination of salt and drought stress. These plants were treated with 200 mM NaCl for two days and continued dehydration for two weeks. Scale bar = 5 cm. (B) Chlorophyll content (Chl-a, Chl-b, and carotenoid, mg. g−1.FW) in both the control (Con) and salt-drought stress groups (S-D). (C) Chlorophyll fluorescence parameter Fv/Fm in both Con and S-D group. (D) Leaf electrolyte leakage (%) in Con and S-D group. (E) Leaf water content (%) in both Con and S-D group. The values of each column are the means ± S.D. of three biological replicates. Asterisks labeled above the columns indicate a significant difference at the p ≤ 0.05 level by Duncan’s test using SPSS software (version 22.0).

