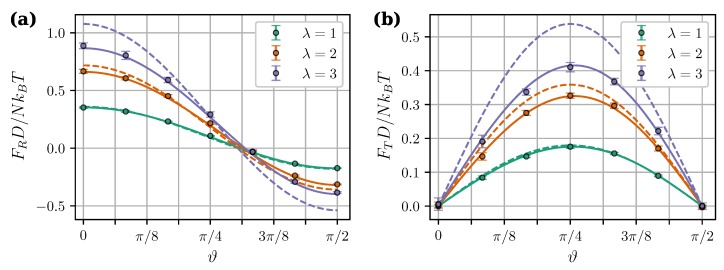
Figure 7.
Central (a) and tangential (b) components of the magnetic intercluster force per core as a function of angle . , , . Different colors correspond to different (see legend). Symbols are simulation results for , solid curves are from the “mutual dipoles model” (MDM) [Equations (23), (24), (29)–(32)], and dashed curves are from the “Langevin dipoles model” (LDM) [Equations (27) and (28)].

