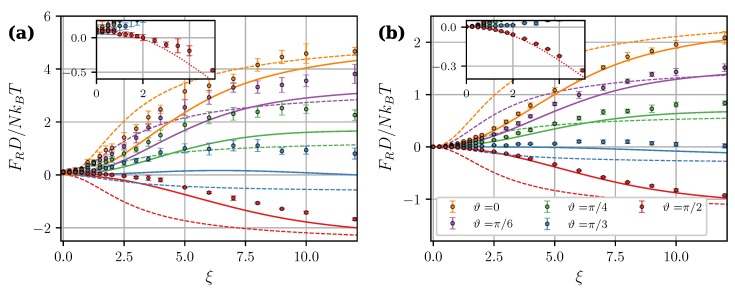
Figure 10.
Magnetic central force per core as a function of the applied field at and . (a) and 1.2 (b). Different colors correspond to different angles (see legend in (b)). Symbols are simulation results for , solid curves are from MDM [Equations (23), (29)–(32)], dashed curves are from LDM [Equation (27)]. Insets show an enlarged view of the weak-field part of simulated dependencies. Dotted lines in insets are MDM predictions for shifted upwards along the y-axis to coincide with the simulation data at .

