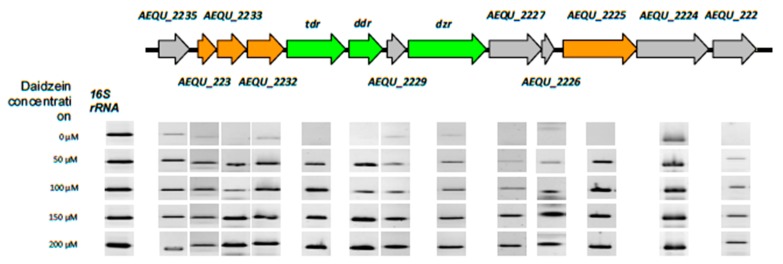
Figure 3.
Schematic organization and RT-PCR analysis of genes in the equol biosynthesis cluster of A. equolifaciens DSM19450T. Color key: in green, genes proved to be involved in the conversion of daidzein to equol, as reported for S. isoflavoniconvertens [29]; in orange, genes with putative activity in daidzein metabolism; in gray, other genes. The band intensity represents the level of transcription of each individual gene in the presence of the different daidzein concentrations tested (on the left). As a control, the expression of the 16S rRNA genes was used.

