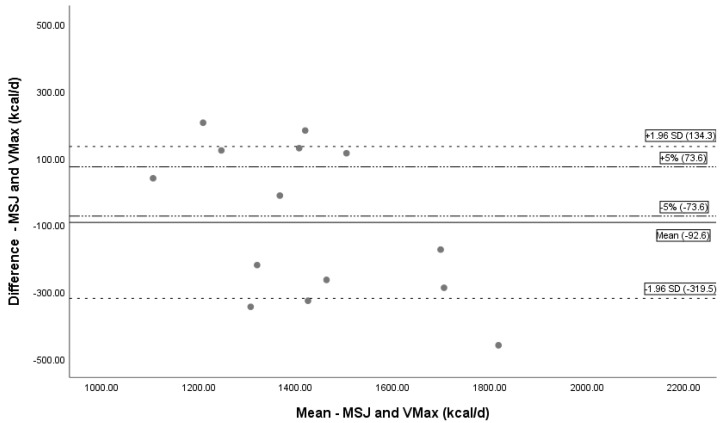
Figure 6.
Bland–Altman Plot MSJ and Vmax. Bland–Altman plot showing the mean bias and limits of agreement between MSJ and Vmax. The black solid line represents mean bias (−92.6 kcal/day), a systematic underprediction of REE by HBE. Dashed lines represent confidence intervals (± 1.96 SD). Dotted and dashed lines are a reference line for ± 5% difference. Abbreviations: REE = resting energy expenditure; MSJ = Mifflin St. Jeor equation, d = day.

