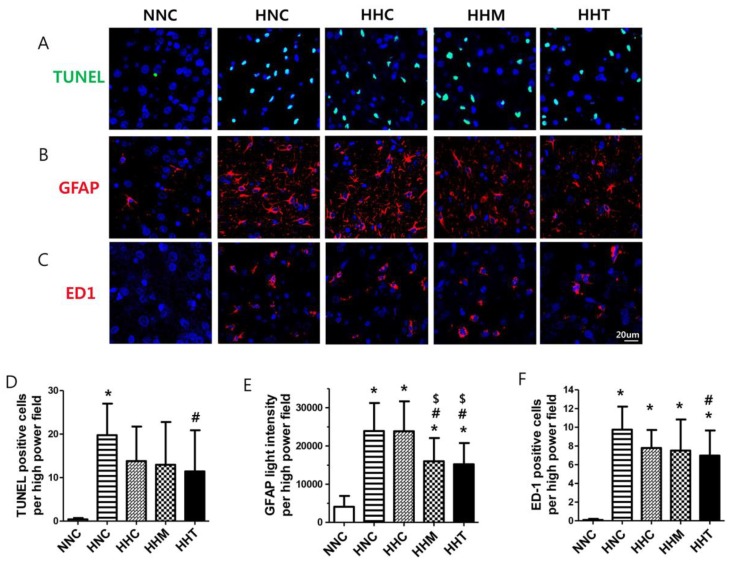
Figure 3.
Effects of thrombin-primed MSCs on brain cell death, reactive gliosis, and activated microglia 3 days after HIE. Representative fluorescence micrographs of the penumbra area with staining for (A) TUNEL (green, upper panel), (B) glial fibrillary acidic protein (GFAP) (red, mid panel), and (C) ED-1 (red, lower panel). DNA was counter-stained with 4′,6-diamidino-2-phenylindole (blue) (original magnification; ×400, scale bars; 20 μm). (D) Average number of TUNEL-positive cells, (E) average intensity of GFAP, and (F) average number of ED-1 positive cells, respectively, in the penumbra area (n = 9, 28, 9, 28, and 26 in NNC, HNC, HHC, HHM, and HHT, respectively). Data are expressed as mean ± SD. * p < 0.05 vs. NNC, # p < 0.05 vs. HNC, $ p < 0.05 vs. HHC.

