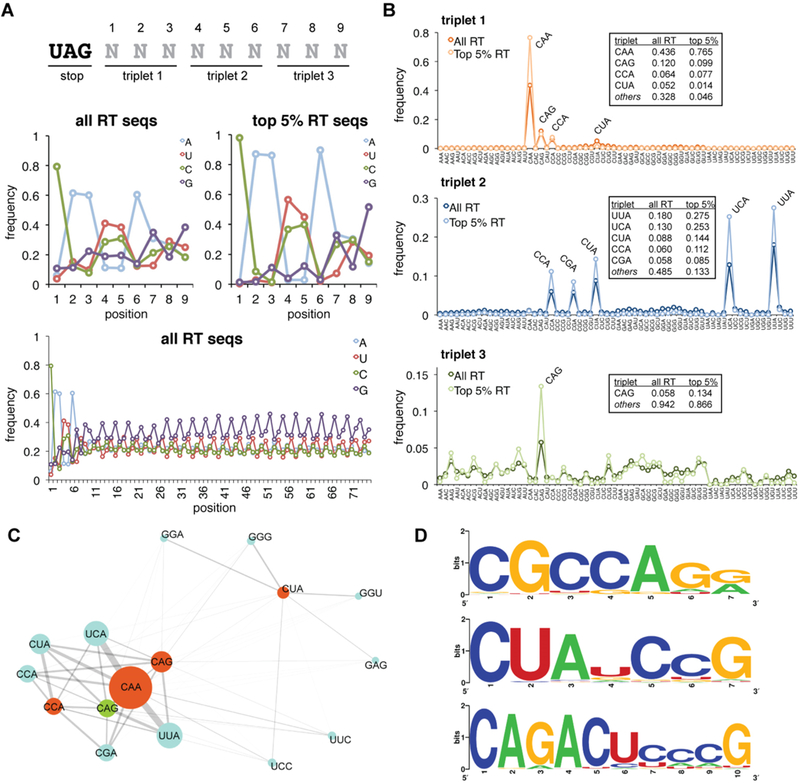
Figure 2.

Analysis of primary sequence readthrough features from HTS data. (A) Position-specific nucleotide frequencies within the randomized library region are shown for the full readthrough (RT) data set and the group of sequences ranked in the top 5% based on read abundance. The first nine nucleotide positions are displayed as well as the frequencies across the full library region. (B) Analysis of triplet nucleotide frequencies. Position-specific triplet nucleotide frequencies are displayed for the full readthrough data set and the top 5%, for comparison. Numerical frequencies are tabulated for the most frequently observed triplets. (C) Connectivity map displaying associations between nucleotide triplets at positions 1 (orange), 2 (blue), and 3 (green). The triplet abundance is illustrated by the diameter of the circle; the strength of association is represented by the connector weight. (D) Sequence logos for additional readthrough motifs identified. Logos were generated from the set of sequences with a Hamming distance of ≤1 for CGCCAGR and CUAUCCG and a Hamming distance of ≤2 for CAGACUCCCG.
