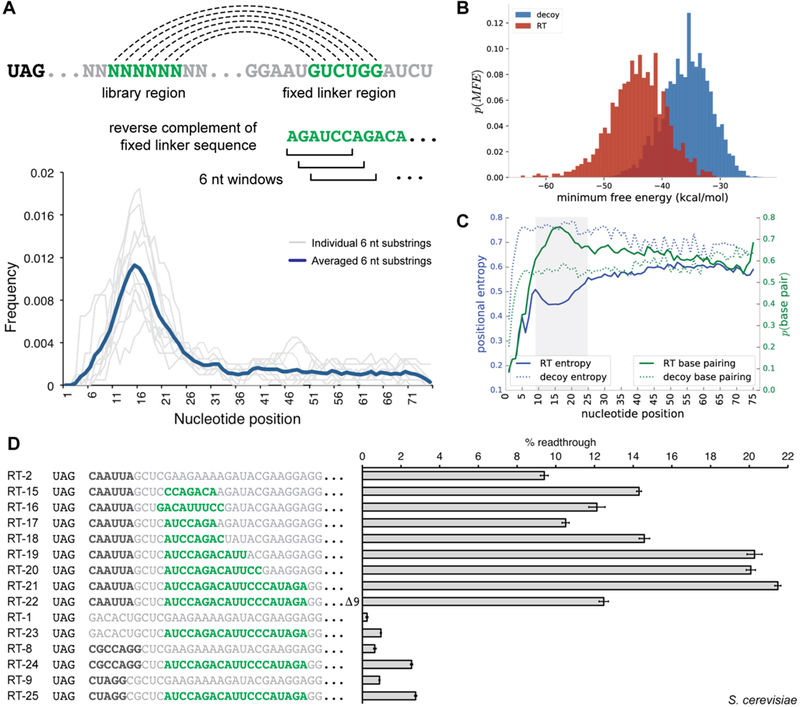
Figure 4.

Analysis of readthrough-stimulating secondary structures from HTS data. (A) Sequence substrings complementary to downstream fixed linker regions have the potential for secondary structure formation; six-nucleotide windows were scanned across the library region of readthrough sequences in search of defined complementary sequence substrings. Density plots for individual six-nucleotide substrings (gray lines) and the averaged density for all evaluated substrings (dark blue) are displayed. (B) Secondary structures for sequences in the readthrough (RT) and FLAG decoy data set were predicted with RNAfold; minimum free energies (MFEs) are shown plotted as a histogram for the two populations. (C) Plots of position-specific base pairing probabilities and positional entropies averaged over a subset of sequences from the readthrough and decoy FLAG data sets. The shaded region represents an area of increased base pairing probability and decreased positional entropy when compared to the remaining library region. (D) Dual-FP reporter assays in yeast evaluating the influence of secondary structure on readthrough activity. Primary sequence readthrough motifs are indicated by bold black type. Sequence with secondary structure potential is indicated by bold green type. Error bars represent the standard error of the mean for six or more biological replicates.
