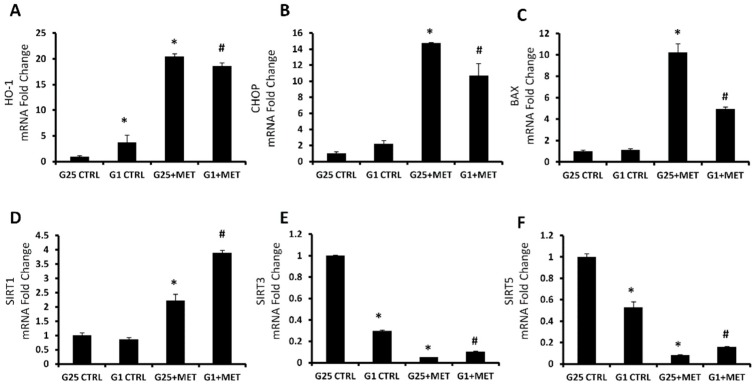
Figure 3.
MRNA expression of HO-1 (A), CHOP (B), BAX (C), SIRT1 (D), SIRT3 (E), and SIRT5 (F), of control cells with 25 mM glucose (G25 CTRL), control cells with 1 mM glucose (G1 CTRL), G25 treated with 10 mM metformin (G25 + MET), and G1 treated with 10 mM metformin (G1 + MET). Results are mean ± SD, * p < 0.05 vs. G25 CTRL, # p < 0.05 vs. G1 CTRL.

