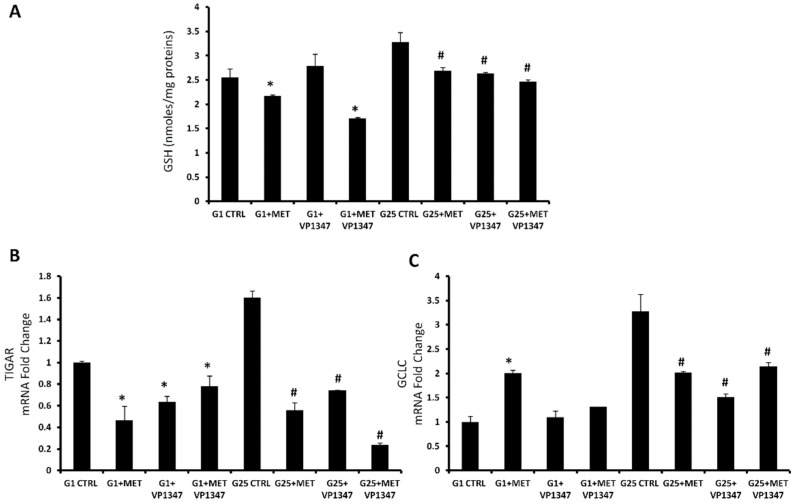
Figure 5.
Metformin regulates oxidative stress pathway. (A) Thiol groups in DU145 cells treated for 24 h with 10 mM metformin and 10 uM VP1347. Thiol groups are expressed as nmol/mg protein. Values represent the means ± SD of three experiments performed in triplicate. * p < 0.05, significant result vs. untreated DU145 cells. (B,C) MRNA expression of TIGAR and GCLC of control cells with 25 mM glucose (G25), control cells with 1 mM glucose (G1), in the presence and absence of 10 mM metformin (MET) and 10 µM VP1347 for 6 h. Results are mean ± SD, * p < 0.05 vs. G25 CTRL, # p < 0.05 vs. G1 CTRL.

