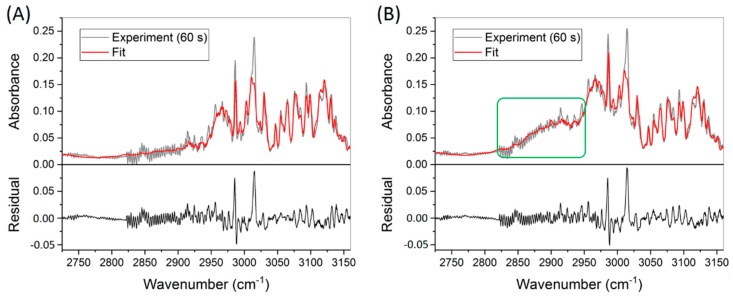
Figure 8.
Measured (grey) and fitted (red) absorbance spectra associated with the first (A) and last (B) concentration data points in Figure 7. The residuals are included on the bottom. The green square in (B) highlights an increased ethanol concentration. A Savitzky–Golay filter is applied in the 2725–2821 cm−1 window in order to minimize the etalon effect due to optical elements.

