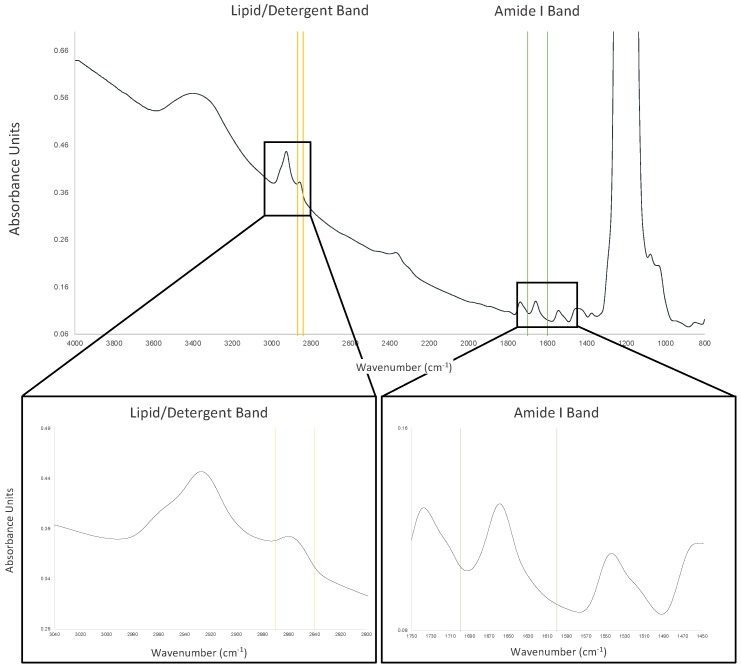
Figure 9.
Mid-infrared spectrum of a membrane protein in n-Dodecyl-β-d-Maltopyranoside (DDM). Measurements were performed using the direct detect spectrometer (EMD Millipore). The protein sample (2 µL) was blotted onto a hydrophilic polytetrafluoroethylene (PTFE) membrane and dried for 30 s using the built-in heater/fan system before measuring the MIR spectrum. The spectrum is plotted against the inverse of the wavelength (the wavenumber). Yellow represents the aliphatic C–H stretching region of DDM between 2870 and 2840 cm−1. Green represents the amide I region between 1700 and 1600 cm−1. Note the strong signal between 1300 and 1100 cm−1 due to the PTFE membrane [121].

