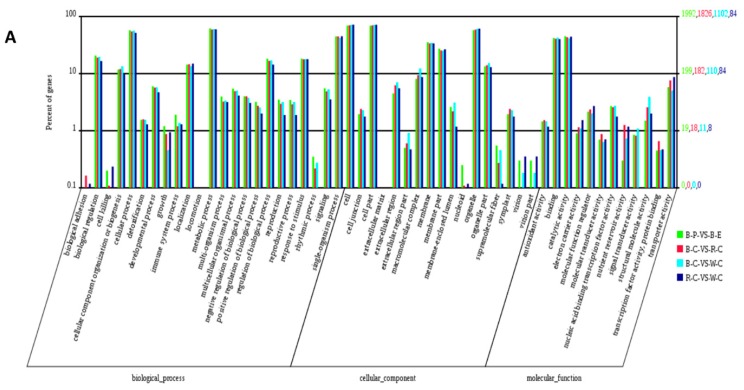
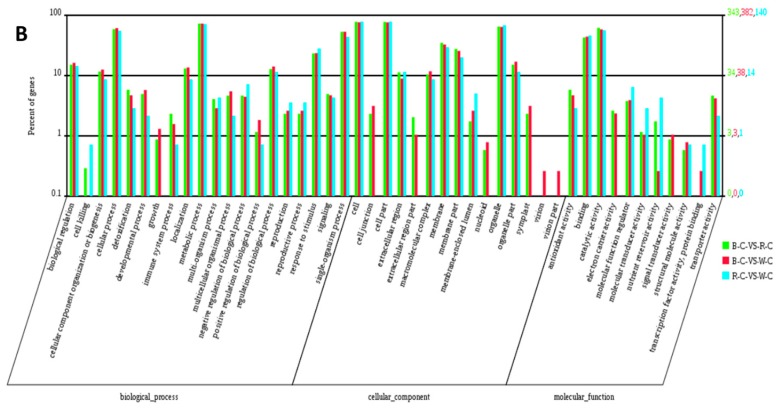
Figure 2.
Gene ontology (GO) function depiction of the DEGs and DEPs by WEGO analysis. (A) Web Gene Ontology Annotation Plotting (WEGO) analysis of the different comparisons for the transcriptome, and (B) WEGO analysis of the different comparisons for the proteome. The abscissa represents each GO term. The left Y-axis represents the percentage of each term, whereas the right Y-axis represents the genes/proteins corresponding to each GO term. Different colored bars represent different comparisons.


