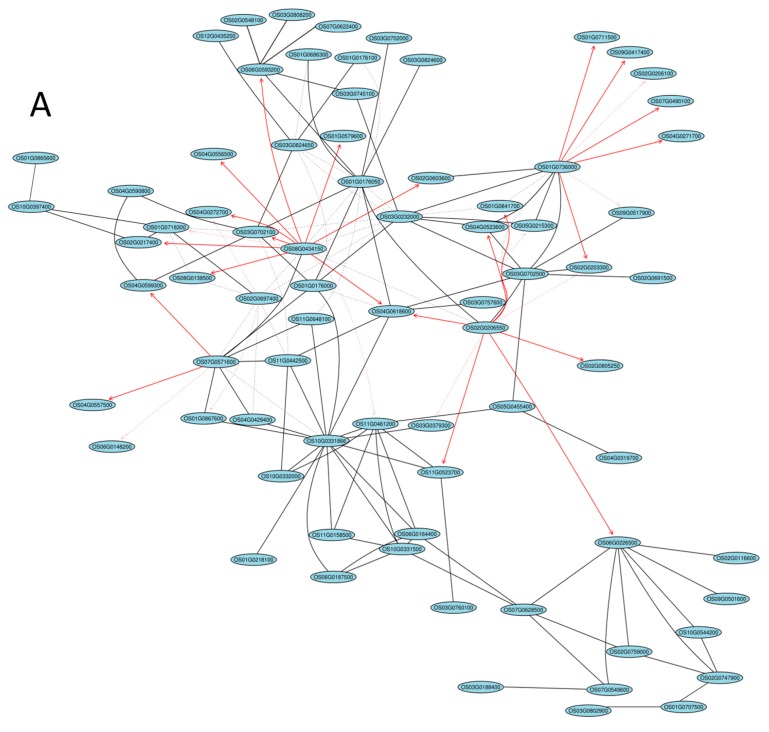
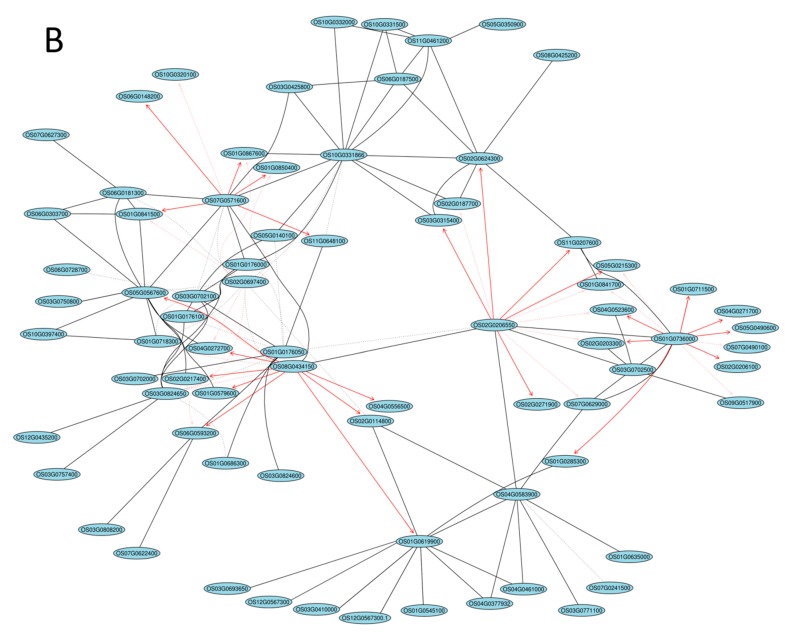
Figure 4.
Network analysis between different pathways and flavonoid synthesis. (A) Basic helix-loop-helix (bHLH) and flavonoids; (B) Myeloblastosis (MYB) and flavonoids. The solid and dotted lines indicate positive and negative correlation coefficients, respectively, and the line intensity denotes their strength. Each straight arrow, from tail to head, indicates the interaction direction. A red color indicates that the Pearson’s correlation coefficient is greater than 0.8. The gene networks were obtained using the “GeneNet” method from the R package. The top 100 largest absolute correlations are displayed.


