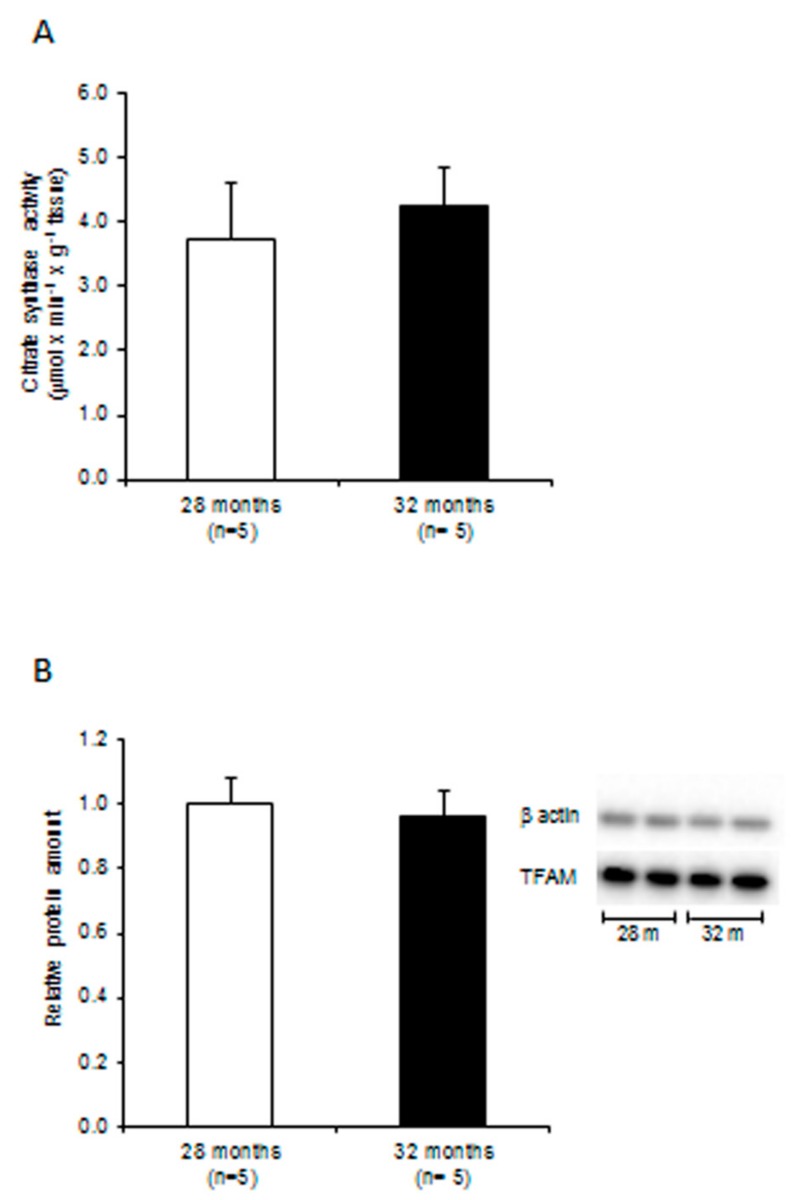
Figure 1.
Citrate synthase activity and mitochondrial transcription factor A (TFAM) relative amount in liver from 28- and 32-month-old rats. (A) Citrate synthase activity. Bars represent the mean value and SEM of experiments performed in quadruplicate. (B) Relative amounts of TFAM. Bars represent the mean and standard error of the mean (SEM) of the relative TFAM/β-actin value, obtained by densitometry analysis of the results from triplicated western blot experiments, from each 28- and 32-month-old rat. The comparison was made with respect to the value of the 28-month-old rats, fixed as 1. Right panel: representative western blot carried out in two rats from each assayed group. The bands, from top to bottom, show the signals from β-actin and TFAM; n = number of analyzed animals.

