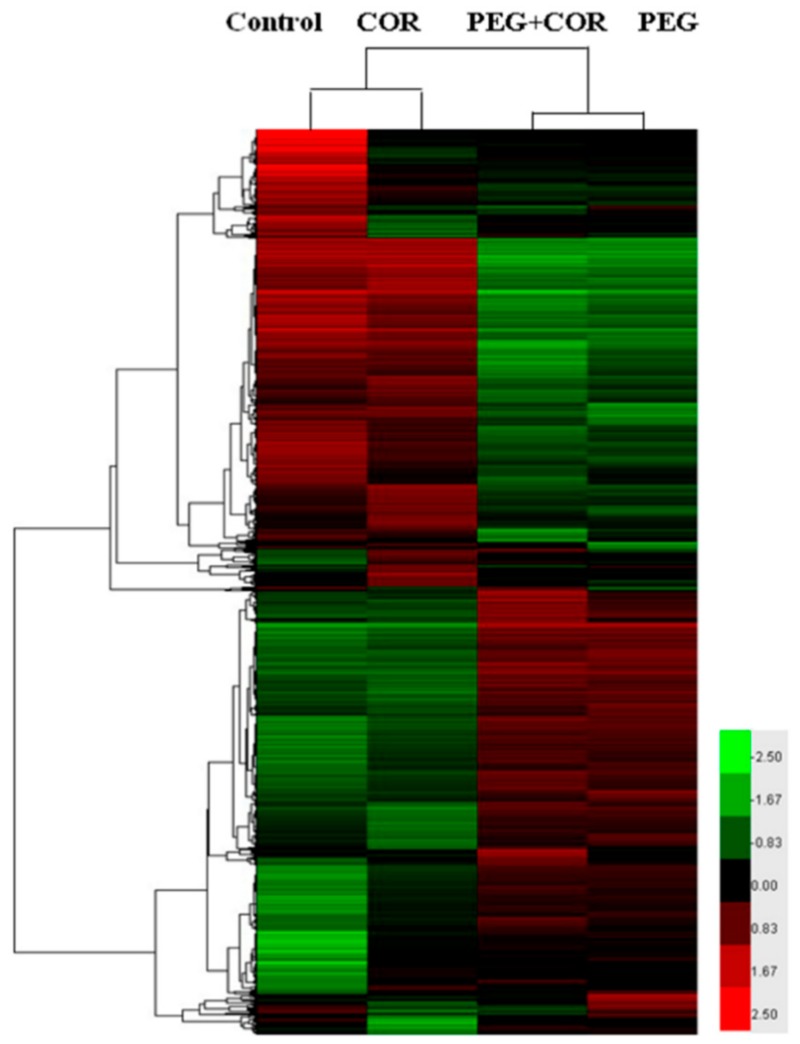
Figure 3.
Effects of coronatine on the transcriptional profiles of rice leaf blades under drought stress. Cluster analysis of differential display genes response to COR under drought stress condition. Each column represents Log2 ratio (Cy5/Cy3) of the different gene. The black color represents the ratio of 1:1; the red is for greater than 1:1.

