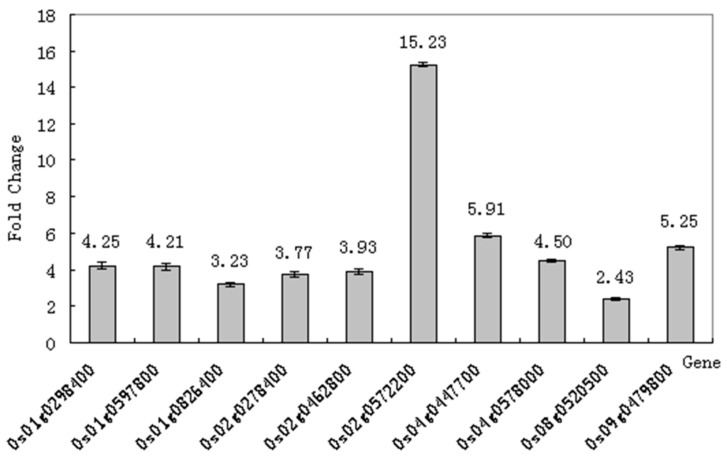
Figure 6.
Transcriptional changes were analyzed using RT-qPCR. The expression gene annotation can be found in Table 3, the primers used for the RT-qPCR are presented in Table S1, while the fold change values represent the average of three independent biological replicates for comparison with microarray data, the actin gene was used as an internal control. Values are means of three experiments each with three replications; PEG, Water deficit treatment induced by PEG for 10 h without COR pretreatment; COR+PEG, Pretreatment with 0.1 μM COR for 12 h before PEG treatment. The sample was collected 10 h after treatment.

