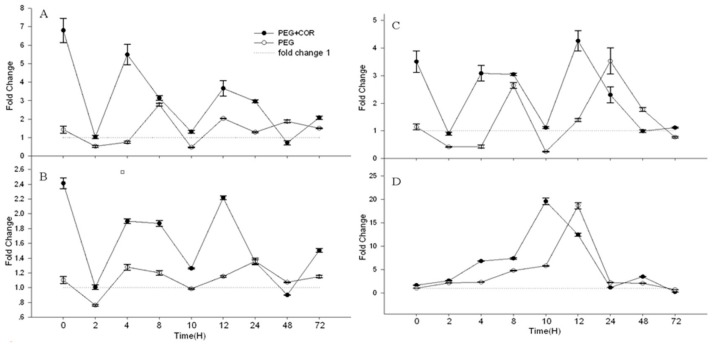
Figure 7.
The changes of four genes expression in relation with the time. The expression data are presented for (A): Os01g0298400 (MYB9), (B): Os08g0520500 (ARF2), (C): Os04g0578000 (ACS) and (D): Os04g0447700 (DCHS). PEG, Water deficit treatment induced by PEG for 10 h without COR pretreatment; COR+PEG, Pretreatment with 0.1 μM COR for 12 h before PEG treatment. The sample was collected in 2 h, 4 h, 8 h, 10 h, 12 h, 24 h, 48 h, and 72 h.

