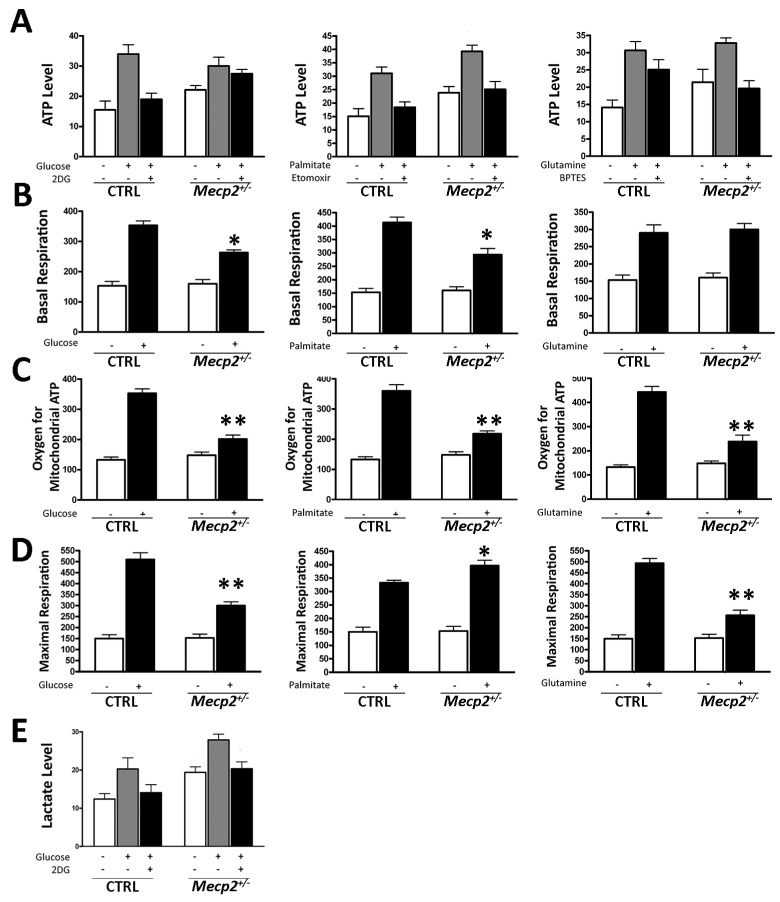
Figure 3.
Evaluation of metabolic activity. (A) Intracellular ATP level evaluation by the ATP colorimetric/fluorometric assay. The cells were incubated in a medium containing glucose (left graph), palmitate (middle graph), or glutamine (right graph). The ATP level was measured in the absence of an energy substrate (white bars), in the presence of a specific substrate (gray bars), and in the presence of a substrate and its inhibitor (black bar). The data are expressed as ATP concentration (nM) (±SD, n = 5 biological replicates). (B) Basal oxygen consumption rate. We used the MitoXpress® Xtra assay for measurement of extracellular oxygen consumption rates (OCR). Cells were incubated in a medium containing glucose (left graph), palmitate (middle graph), or glutamine (right graph). For every condition, the asterisk (*) denotes significant differences (p < 0.05) between OCR in the Mecp2+/− versus CTRL MSCs. Data are expressed in arbitrary units (±SD, n = 5 biological replicates). (C) Oxygen for mitochondrial ATP production. OCR was measured following sequential addition of oligomycin that is an inhibitor of the F0 part of H+/ATP synthase in mitochondria. The cells were incubated in a medium containing glucose (left graph), palmitate (middle graph), or glutamine (right graph). For every condition, the asterisk denotes significant differences (** p < 0.01) between OCR in Mecp2+/− versus CTRL MSCs. Data are expressed in arbitrary units (±SD, n = 5 biological replicates). (D) Maximal respiration rate. OCR was measured following sequential addition of FCCP, that is, a protonophore and uncoupler of oxidative phosphorylation in mitochondria. The cells were incubated in a medium containing glucose (left graph), palmitate (middle graph), or glutamine (right graph). For every condition, the asterisk denotes significant differences (* p < 0.05; ** p < 0.01) between maximal OCR in the Mecp2+/− versus CTRL MSCs. Data are expressed in arbitrary units (±SD, n = 5 biological replicates). (E) Lactate level evaluation by the Lactate Assay Kit. The cells were incubated in a medium containing glucose with and without 2D-glucose, an inhibitor of glycolysis flux. The data are expressed as lactate concentration (nM) (±SD, n = 5 biological replicates).

