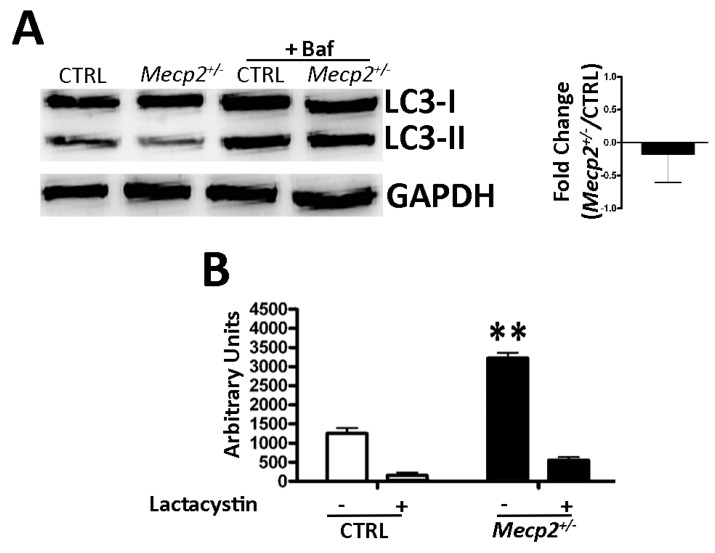
Figure 4.
Autophagy and proteasome activity assays. (A) Autophagic flux evaluation. The picture shows western blot detection of LC3-I and LC3-II in the Mecp2+/− and CTRL MSCs. Mecp2+/− and CTRL MSCs were incubated with 100 nM bafilomycin A1 (inhibitor of lysosomal degradation) or phosphate-buffered saline (PBS) to detect autophagic flux. We used Gel Doc 2000 Gel Documentation Systems (Bio-Rad, Hercules, CA, USA) to measure LC3-I and II band intensities that were normalized with GAPDH as internal control. We determined autophagic flux (AF) for LC3 II as follows: Mecp2+/− MSC AF = (Mecp2+/− MSCs + Bafilomycin A1) − (Mecp2+/− MSCs + PBS); CTRL MSC AF = (CTRL MSCs + Bafilomycin A1) − (CTRL MSCs + PBS). Change in autophagic flux (ΔAF) between Mecp2+/− and CTRL MSCs was calculated as follows: ΔAF = Mecp2+/− MSC AF − CTRL MSC AF. The graph shows AF changes in the Mecp2+/− MSCs compared to CTRL cells. The data are expressed in change folds (±SD, n = 5). (B) Proteasome activity. Mecp2+/− and CTRL cells were harvested for a fluorometric assay determination of proteasome activity. Mecp2+/− and CTRL cultures were incubated with 25 μM lactacystin (a specific inhibitor of proteasomes) or PBS. The graph shows proteasome activity in the Mecp2+/− and CTRL cells both in the presence and absence of lactacystin. Data are expressed in arbitrary units (±SD, n = 5; ** p < 0.01) The asterisk denotes significant differences between Mecp2+/− samples versus CTRL ones.

