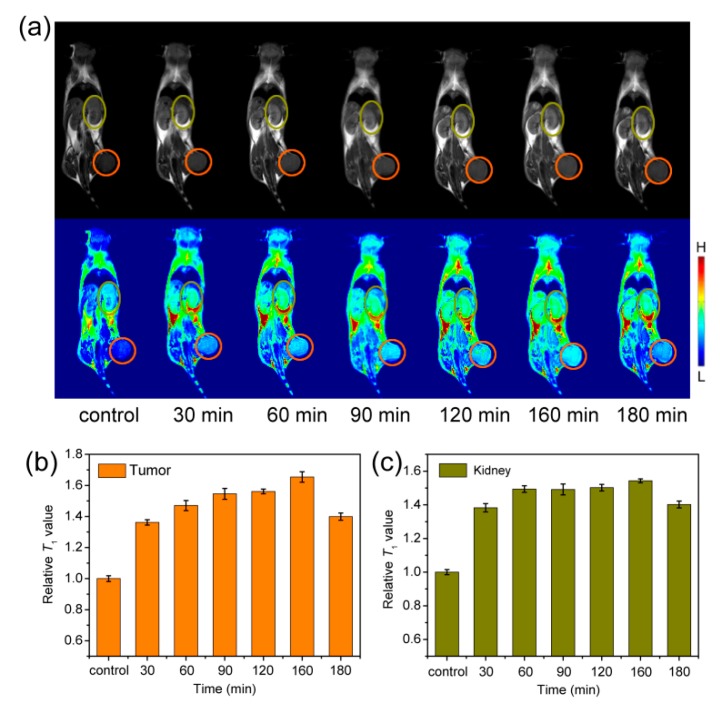
Figure 5.
(a) T1-weighted MR images (B0 = 1 T) of mice collected before (control group) and after intravenous injection of Fe3O4-PAA at time points of 30, 60, 90, 120, 160 and 180 min. The corresponding relative T1-weighted signals extracted from (b) tumor (orange circle) and (c) kidney (dark yellow circle) sites.

