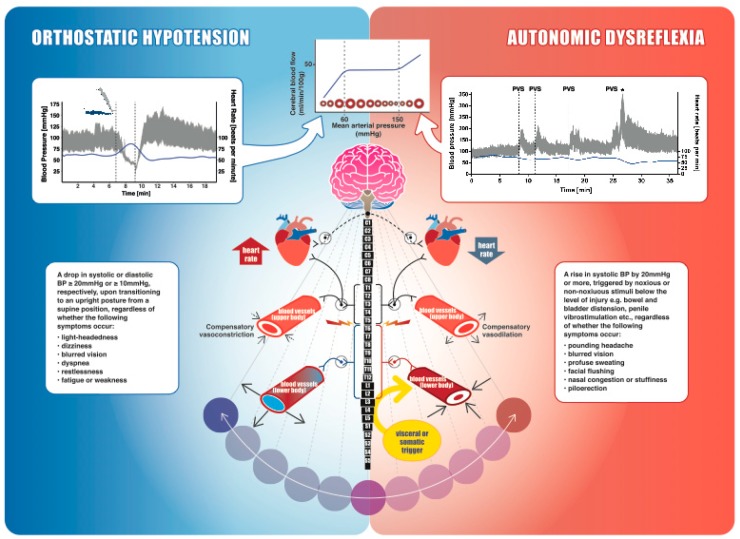
Figure 1.
An overview of spinal cord injury (SCI), autonomic cardiovascular innervation, blood pressure (BP) instability, and cerebral autoregulation. The schematic diagram in the middle demonstrates autonomic control of the cardiovascular system. Parasympathetic control of the heart (dashed line), mediated by the vagus nerve, usually remains intact following SCI. Neurons within the brainstem provide sympathetic tonic control to spinal sympathetic preganglionic neurons. Heart and upper-body blood vessels are innervated via spinal segments T1–T5, whereas the trunk and lower extremity vasculature receive innervation from T6–L2. The splanchnic bed (liver, spleen, and intestines) is densely innervated, highly compliant, and contains approximately one-quarter of the total blood volume at rest, making it the primary capacitance bed. An SCI disrupting the sympathetic control of these vessels (i.e., at or above T6) makes them highly vulnerable to vasodilation and extreme constriction, leading to BP instability. Orthostatic hypotension (shown on the left): cardiovascular changes in a participant with a motor-complete cervical SCI (C5, American Spinal Injury Association Impairment Scale (AIS) A) during a head-up-tilt assessment. Beat-by-beat BP is shown in grey, and heart rate is shown in blue. BP plummeted immediately upon initiation of 60° upright tilt from the supine position and the tilt was terminated after 2 min. Mean arterial pressure was recorded as 25 mmHg at its lowest, well below the lower limit of cerebral autoregulation (top middle inset). Rebound hypertension was also apparent when the participant was returned to the supine position, further emphasizing the instability in blood pressure regulation. Autonomic dysreflexia (shown on the right): cardiovascular changes in a male with motor-incomplete SCI (C6, AIS C) during a sperm retrieval procedure with penile vibrostimulation (PVS), which is a visceral/somatic trigger originating below the spinal lesion. The dashed lines indicate each time the PVS is applied and is followed by significant and rapid increases in BP. * indicates ejaculation. In this case, systolic BP almost triples and mean arterial pressure is ~250 mmHg, well above the upper limit of cerebral autoregulation (top Figure). Cerebral autoregulation curve (shown on the top): cerebral blood flow (CBF) is shown in relation to cerebral artery lumen diameter and mean arterial pressure. The dashed lines represent the lower and upper limits of CBF autoregulation, which are exceeded by our clinical orthostatic and autonomic dysreflexia examples. Red circles represent the cerebral arteries (either vasodilating or vasoconstricting to counteract changes in systemic blood pressure), and the blue solid line represents cerebral blood flow.

