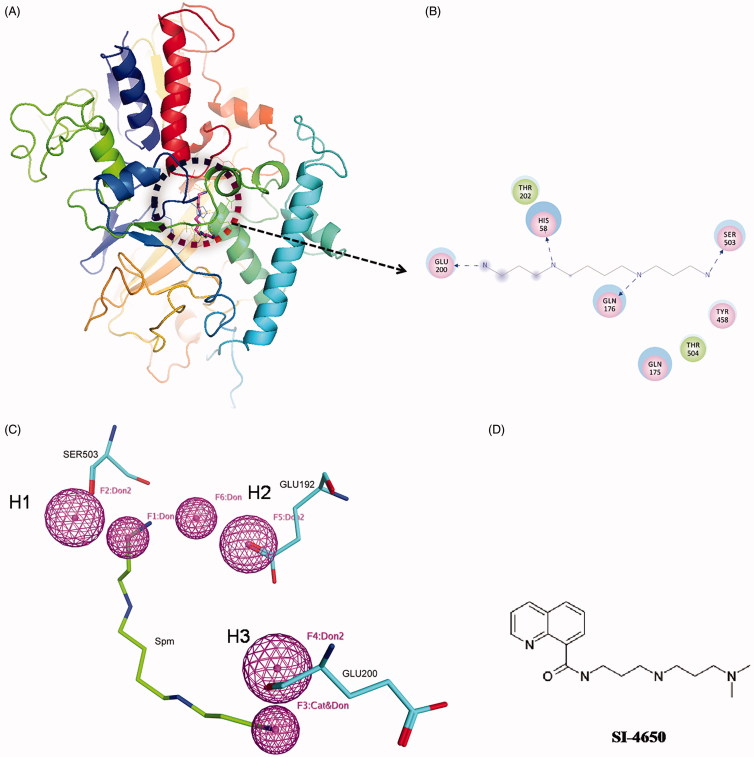
Figure 1.
The virtual screening of SMO inhibitors. (A) The complex structure of Spm and SMO. The circle represents the binding site and the Spm is shown in pink. (B) The detailed interactions of SMO with Spm. Pink circles represent residues involved in hydrogen bonds interactions. Green circles represent residues involved in van der Waals interactions. Blue dashed arrow represents hydrogen bond. (C) The pharmacophore model developed based on the structure of Spm and SMO. The pharmacophore features are colour coded with pink for hydrogen bond features (H1, H2, and H3). Mapping of Spm with the pharmacophore model. (D) The chemical structure of SI-4650.

