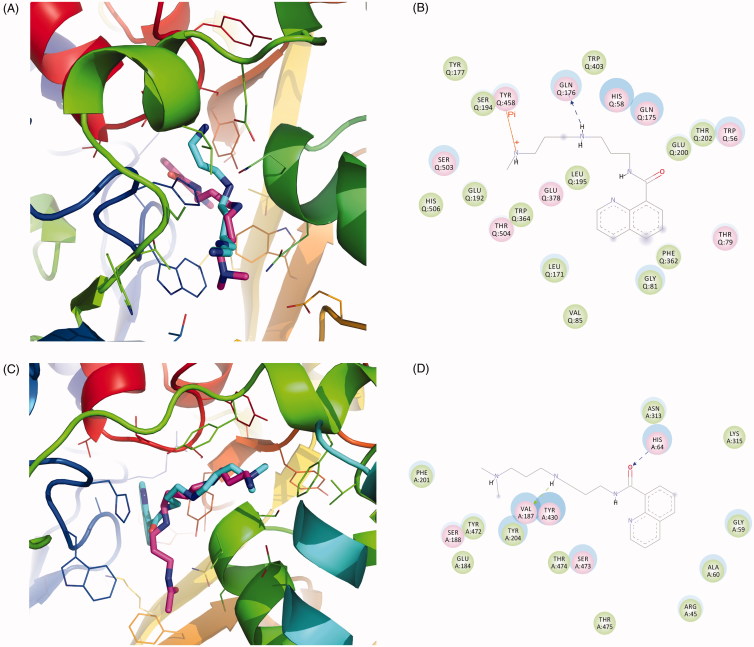
Figure 3.
The binding mode analysis of SI-4650. The binding modes of SI-4650 in SMO (A) and APAO (C). Pink represents substrate and cyan represents SI-4650. The detailed interactions of SI-4650 with SMO (B) and APAO (D). Blue dashed arrow represents hydrogen bond. Orange line with symbols represent cation-Pi interaction.

