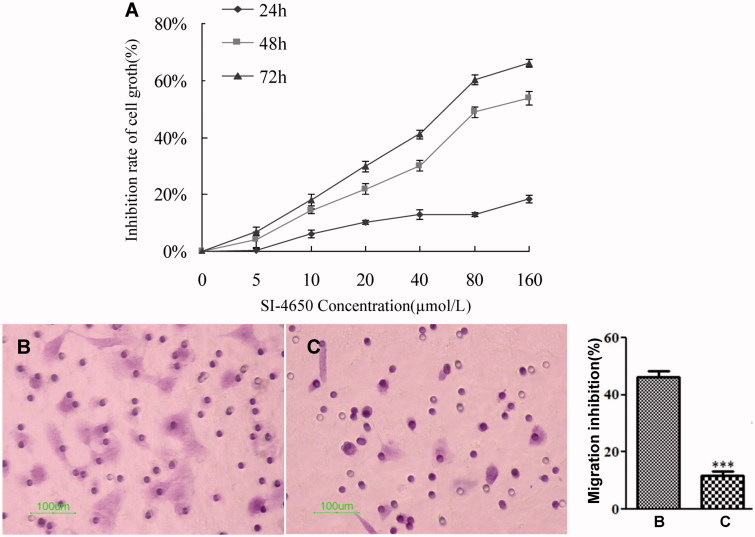
Figure 4.
The effects of SI-4650 on cell proliferation and migration in A549 cells. (A) A549 cells were treated with 0, 5, 10, 20, 40, and 80 and 160 µmol/L SI-4650 for 24, 48, and 72 h. Cell proliferation was then performed by using the MTT assay. The data are shown as means ± SD. (B) A549 cells were starved for 24 h and then treated with SI-4650 at 80 μM for 24 h. The numbers of migrated cells were counted under an inverted fluorescence microscope in five randomly selected visual fields per well within the same area. Scale bar: 100 μm. (C) Percent migration inhibition rate relative to control treated A549 cells. The values are presented as the means ± SD from three independent experiments (Student’s t-test), ***p < 0.001.

