Figure 1.
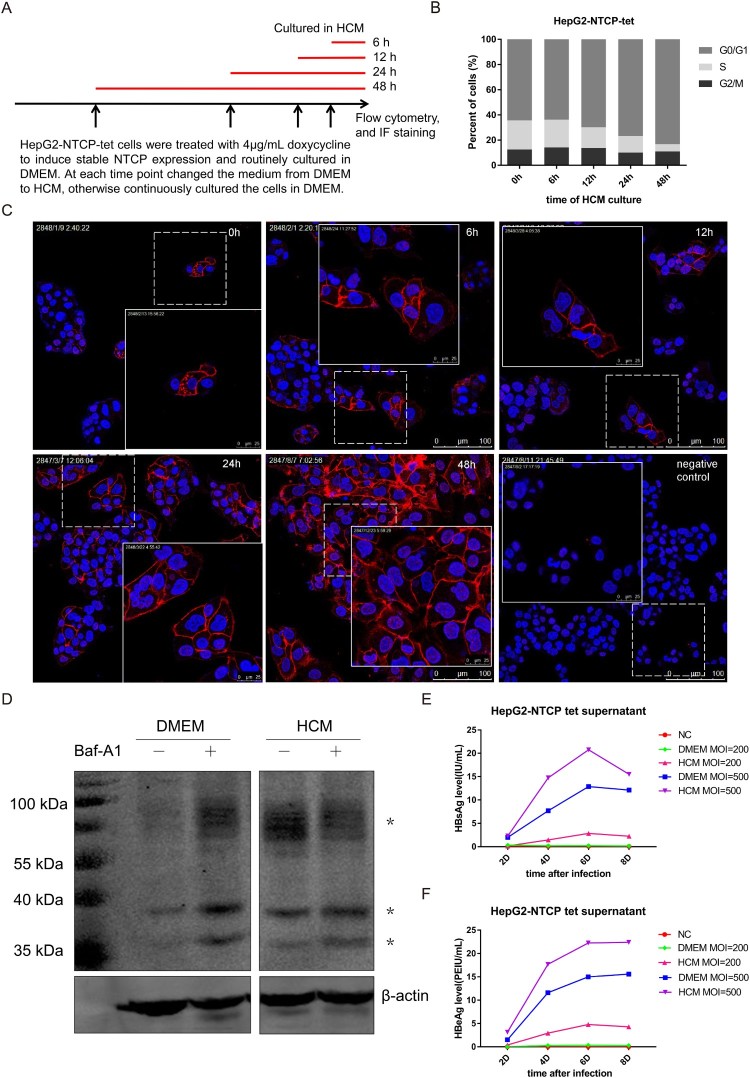
Elevated cell membrane expression of NTCP in HepG2-NTCP-tet cells increases HBV susceptibility. (A) The schematic diagram of treating HepG2-NTCP-tet cells in HCM medium for different time points. (B) Percentage of DOX-treated HepG2-NTCP-tet cells in each phase of the cell cycle (tested by flow cytometry cell cycle assays) at the different time points of HCM culture. (C) Immunofluorescent staining for NTCP of DOX-treated HepG2-NTCP-tet cells cultured in HCM for different times. HepG2-NTCP-tet cells without DOX treatment as negative control. (D) HepG2-NTCP cells were cultured in DMEM or HCM respectively for 24 h, and then treated with or without 10 nM Baf-A1 for another 24 h. The NTCP protein was tested using anti-flag-tag by western blot. “*” represents different bands of NTCP protein. (E, F) Changes of HBsAg and HBeAg in cell culture supernatant of HepG2-NTCP-tet cells at different time points after infected with the HBV particles concentrated from the HepAD38 cell culture supernatant. NC: negative control, standing for uninfected cells; DMEM MOI = 200 or DMEM MOI = 500: cells cultured in DMEM with the infection MOI of 200 or 500; HCM MOI = 200 or HCM MOI = 500: cells cultured in HCM with the infection MOI of 200 or 500.

