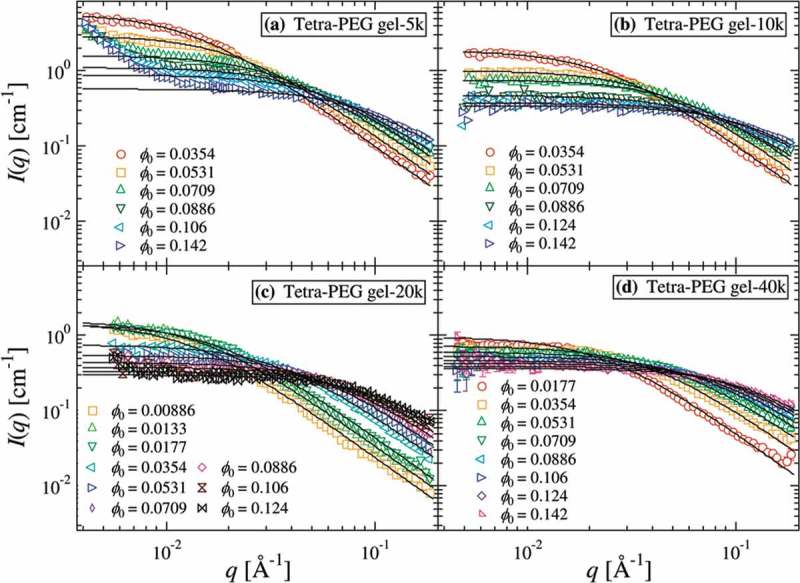
Figure 5.

SANS intensity functions of Tetra-PEG gel (a) 5k, (b) 10k, (c) 20k, and (d) 40k. The solid lines denote the results of curve fitting with Ornstein-Zernike functions (reproduced from Matsunaga et al. [21] with permission. Copyright 2009, ACS Publications).
