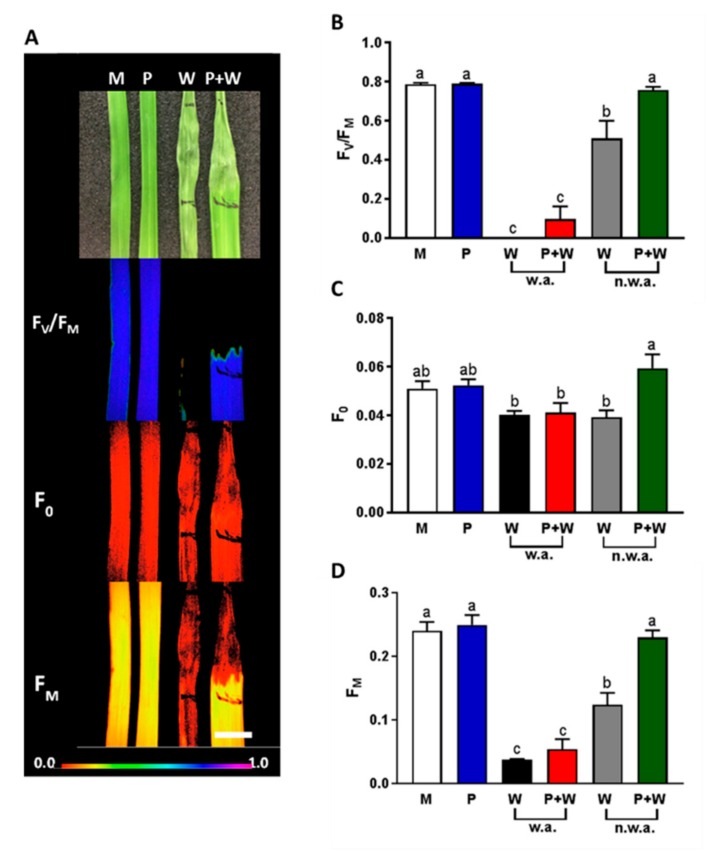
Figure 7.
Measurement of chlorophyll fluorescence. Representative images of rice leaves mock (M); primed with MeJA (P); wounded (W); primed and wounded (P + W) in brightfield, maximum quantum efficiency of Photosystem II (FV/FM), minimal (F0) and maximal fluorescence (FM) (panel A). The color bar below shows the range of fluorescence values. Scale bar: 5 mm. Means (n = 5) ± SE of FV/FM (B), F0 (C) and FM (D) values are shown. In all bar panels, white bars represent M, blue bars P, black bars W (w.a. = wounded area)), red bars P + W (w.a.), grey bars W (n.w.a = near wounded area), green bars P + W (n.w.a.). A one-way ANOVA followed by Tukey’s test was performed to define statistical significance (p < 0.05) of differences among means. Data not sharing the same letters are statistically significantly different.

