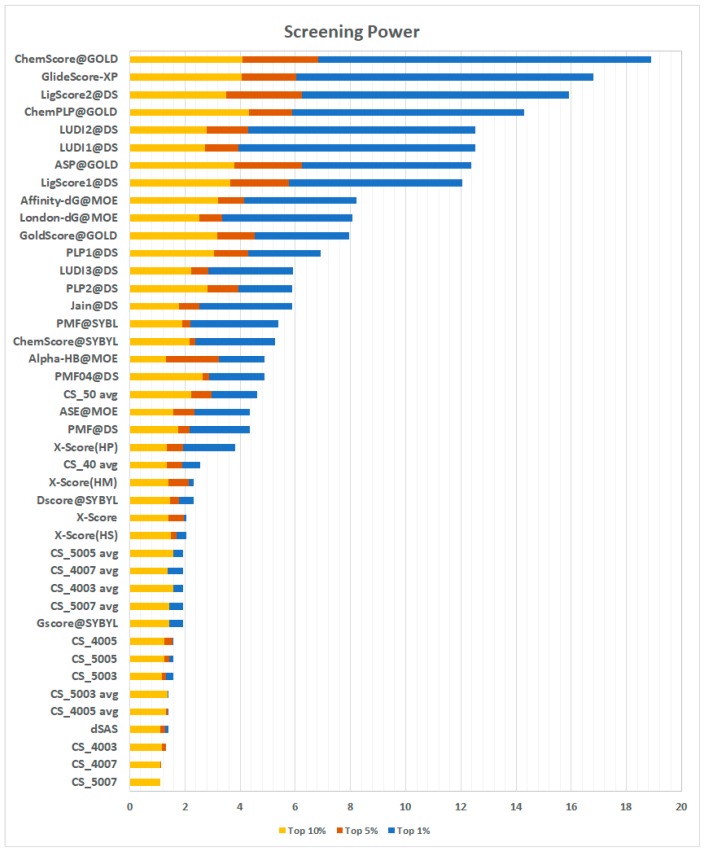
Figure 7.
Results of the screening power test carried out on the CASF-2013 benchmark. In the picture, the results of the proposed method by employing both the sum and the average of the fragments’ contact frequencies (the latter identified by the suffix ‘avg’) are shown. The results are represented in terms of the enrichment factor achieved in the best scoring top 1% (blue bars), top 5% (orange bars), and top 10% (yellow bars) poses.

