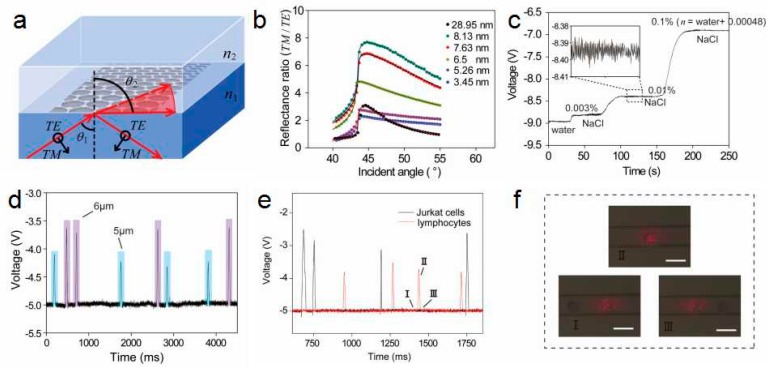
Figure 6.
(a) Schematic of the enhanced sensitivity and resolution of refractive index (RI) sensing of h-rGO. (b) Angle-dependent reflectance ratio (TM/TE) plots of different thicknesses of h-rGO. (c) Real-time signal of different ultralow concentrations of NaCl solution. (d) Discrete time-dependent changes in voltage that corresponds to PS microspheres as they roll across the h-rGO detection window. The light blue and light purple areas represent the discrete voltage signals of 5 and 6 μm PS microspheres, respectively. (e) Discrete time-dependent changes in voltage that corresponds to a single lymphocyte or Jurkat cell as it rolls across the detection window. The black and red lines represent Jurkat cells and lymphocytes, respectively. (f) Microscopic images of the h-rGO detection window as lymphocytes roll across it. The scale bar is 15 μm, and the height of the microfluidic channel is approximately 9 μm. Reproduced from [32] with permission of the American Chemical Society.

