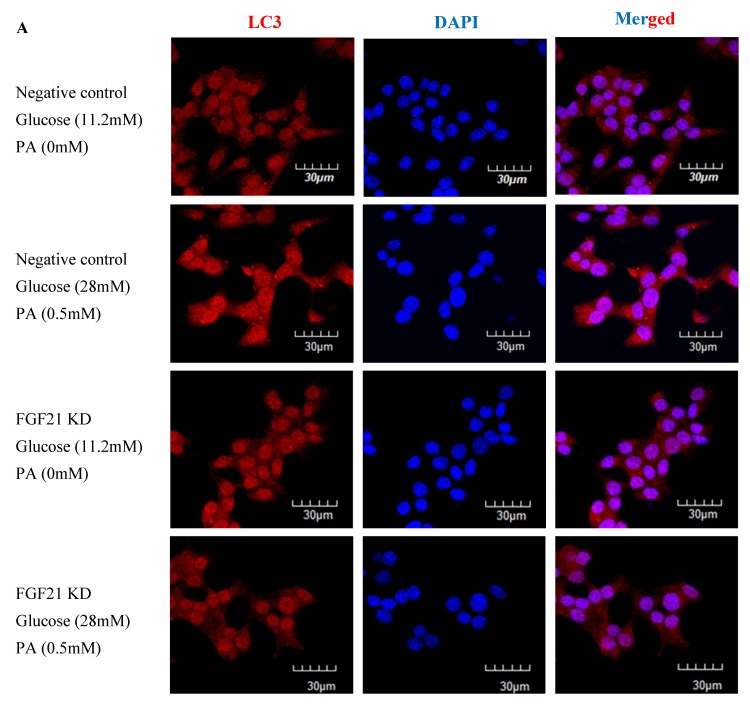
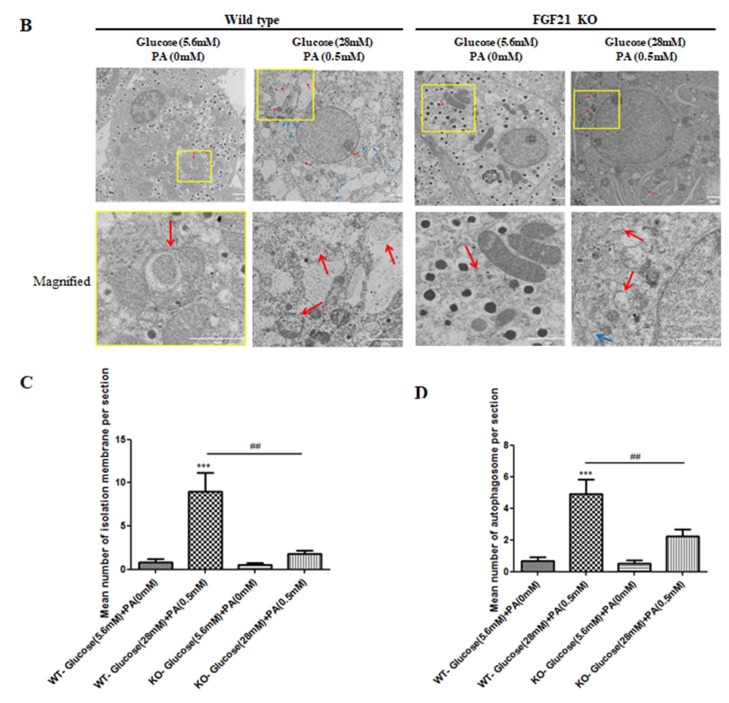
Figure 4.
Induction of reduced formation of isolation membranes and autophagosomes under high-glucose/high-PA conditions in INS-1E cells with FGF21 knockdown and isolated islets with FGF21 KO mice. (A) Fluorescent immunohistochemistry showing decreased expression of cytoplasmic LC3-II in high-glucose/high-PA-treated INS-1E cells compared to non-treated control cells. (B) TEM images demonstrating reduced formation of isolation membranes (blue arrow) and autophagosomes (red arrow) in FGF21 KO islets under diabetic conditions. The yellow square is the area that was magnified. Quantitative summaries of these TEM observations of isolation membranes (C) and autophagosomes (D). Data are means ± SEMs; n = 8–9; ## p < 0.01, and *** p < 0.001.


