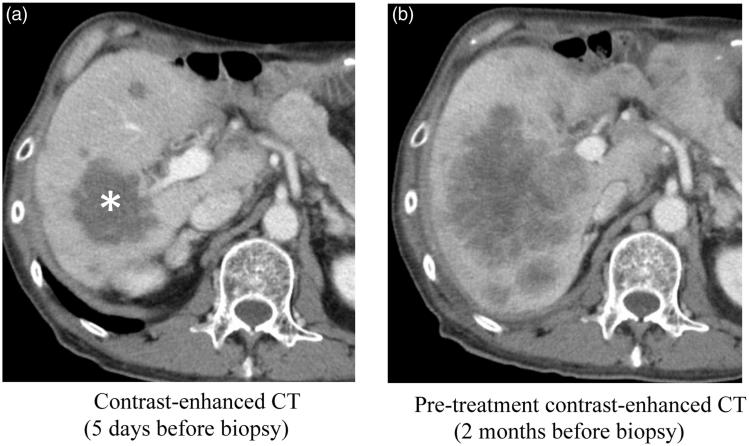
Figure 3.
A case of failed NGS analysis. The patient is a man in his 60s with suspected liver metastases from bile duct cancer. (a) Contrast-enhanced CT 5 days before biopsy, after the anticancer medical therapy in a clinical trial. All the tumors demonstrated low attenuation representing hypovascular tumors. The largest mass in the posterior segment of the liver (asterisk) was selected for the target site of biopsy. Biopsy of five cores from various portions in the tumor was performed under ultrasound guidance. NGS analysis failed, and the pathological diagnosis was necrosis of the tumor. (b) Pre-treatment contrast-enhanced CT 2 months before biopsy. The diameters of the liver tumors are larger than that on post-treatment CT (a), and enhancement effects were seen in the periphery of the tumors.

