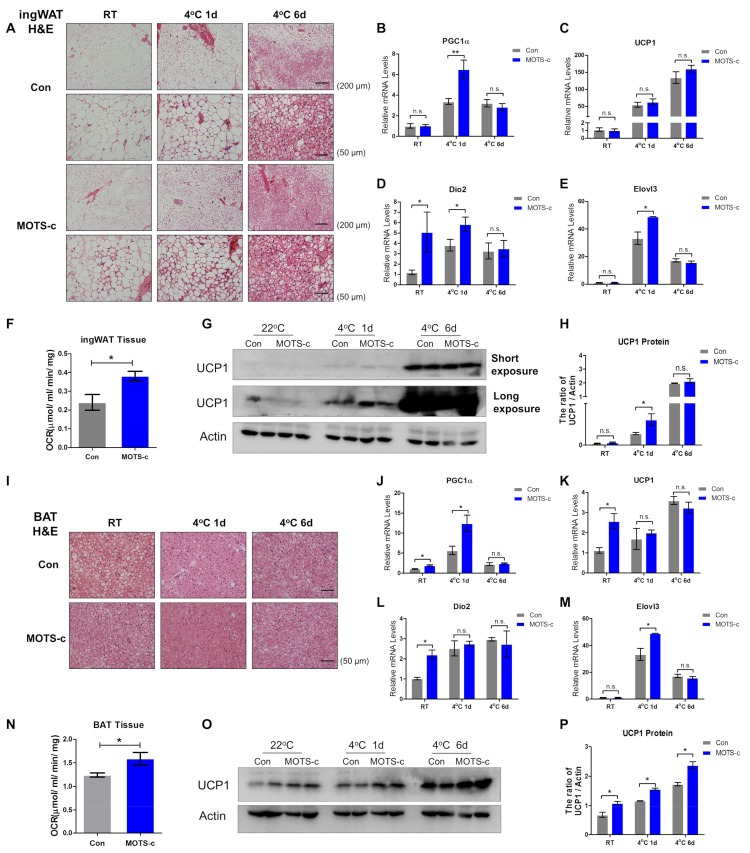
Figure 3.
MOTS-c administration promotes white fat browning and Brown Fat Activation during cold exposure. (A) H&E staining of ingWAT to show the morphologic change during cold exposure (scale bar = 200 and 50 μm). (B–E) The mRNA levels of genes for thermogenesis (PGC1α, UCP1, Dio2, and Elovl3) on the first and sixth days of cold exposure (n = 4, per group). (F) Total oxygen consumption per gram in ingWAT from normal saline (Con) and MOTS-c treated mice under basal conditions were measured using a Clark electrode. (n = 3, per group). (G,H) The protein level of UCP1 detected by Western blot and immunoreactive bands were quantified by densitometric analysis using ImageJ (n = 4, per group). (I) H&E staining of BAT to present the morphologic change during cold exposure (scale bar = 50 μm). (J–M) The mRNA levels of genes for thermogenesis (PGC1α, UCP1, Dio2, and Elovl3) in BAT (n = 4, per group). (N) Total oxygen consumption per gram in BAT from normal saline (Con) and MOTS-c treated mice under basal conditions were measured using a Clark electrode. (n = 3, per group). (O,P) The protein level of UCP1 detected by Western blot and immunoreactive bands were quantified by densitometric analysis using ImageJ (n = 4, per group). All data are represented as mean ± SEM. Differences between the two groups were determined by a two-tailed Student’s t-test. * p < 0.05, ** p < 0.01, n.s. = not significant.

