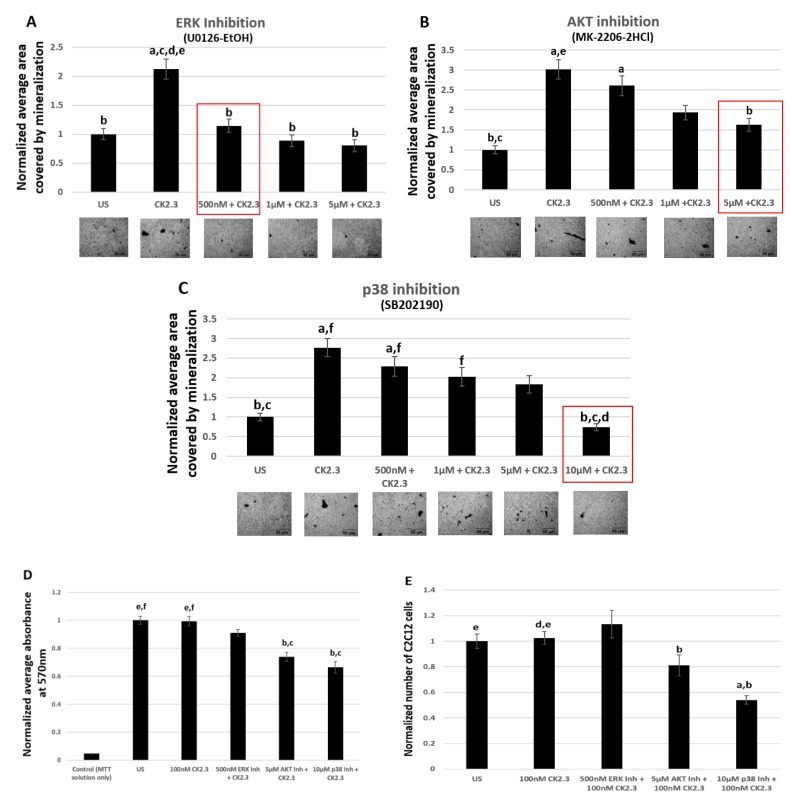
Figure 5.
500 nM of ERK1/2 inhibitor (U0126-EtOH) induces significant reduction in mineralization without affecting the viability of C2C12 cells. Mineralization levels in unstimulated C2C12 cells and cells treated with (A) 500 nM, 1 μM, and 5 μM of U0126-EtOH (ERK 1/2 inhibitor), (B) 500 nM, 1 μM, and 5 μM of MK-2206-2HCl (Akt inhibitor) and (C) 500 nM, 1 μM, 5 μM, and 10 μM of SB202190 (p38 inhibitor); followed by stimulation with 100 nM of CK2.3 was determined using von Kossa assay. (D) Viability of cells and (E) total number of cells after treatment with 500 nM of U0126-EtOH, 5 μM of MK-2206-2HCl, and 10 μM of SB202190 followed by stimulation with 100 nM of CK2.3 was determined using MTT assay and ImageJ analysis, respectively. Data (n = 3) was normalized to unstimulated cells and analyzed using one-way anova and Tukey-Kramer post hoc statistical test (p < 0.05). (A) a = statistically significant difference to unstimulated, b = statistically significant difference to 100 nM CK2.3, c = statistically significant difference to 500 nM ERK1/2 Inh + 100 nM CK2.3, d = statistically significant difference to 1 μM ERK1/2 Inh + 100 nM CK2.3, and e = statistically significant difference to 5 μM ERK1/2 Inh + 100 nM CK2.3. (B) a = statistically significant difference to unstimulated, b = statistically significant difference to 100 nM CK2.3, c = statistically significant difference to 500 nM Akt Inh + 100 nM CK2.3, d = statistically significant difference to 1 μM Akt Inh + 100 nM CK2.3, and e = statistically significant difference to 5 μM Akt Inh + 100 nM CK2.3. (C) a = statistically significant difference to unstimulated, b = statistically significant difference to 100 nM CK2.3, c = statistically significant difference to 500 nM p38 Inh + 100 nM CK2.3, d = statistically significant difference to 1 μM p38 Inh + 100 nM CK2.3, e = statistically significant difference to 5 μM p38 Inh + 100 nM CK2.3, and f = statistically significant difference to 10 μM p38 Inh + 100 nM CK2.3. (D) a = statistically significant difference to control, b = statistically significant difference to unstimulated, c = statistically significant difference to 100 nM CK2.3, d = statistically significant difference to 500 nM ERK1/2 Inh + 100 nM CK2.3, e = statistically significant difference to 5 μM Akt Inh + 100 nM CK2.3, and f = statistically significant difference to 10 μM p38 Inh + 100 nM CK2.3. (E): a = statistically significant difference to unstimulated, b = statistically significant difference to 100 nM CK2.3, c = statistically significant difference to 500 nM ERK1/2 Inh + 100 nM CK2.3, d = statistically significant difference to 5 μM Akt Inh + 100 nM CK2.3, and d = statistically significant difference to 10 μM p38 Inh + 100 nM CK2.3.

