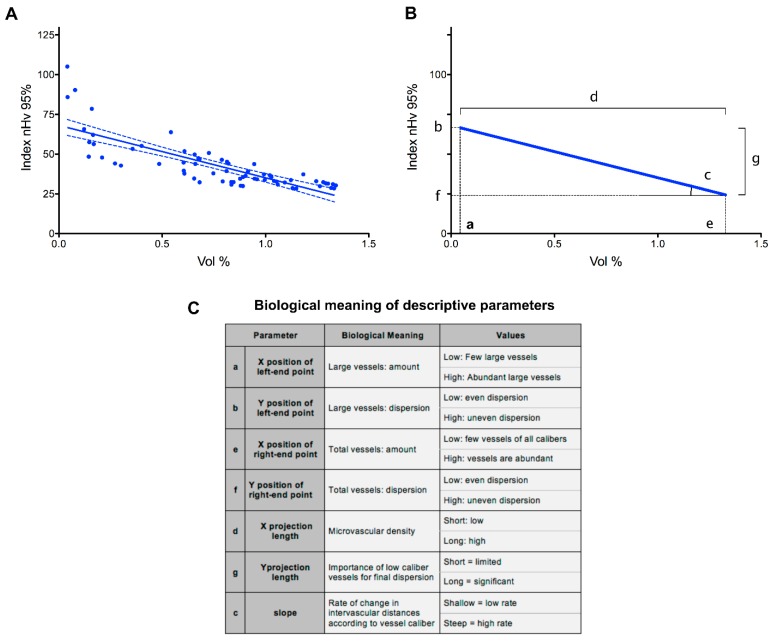
Figure 3.
Graphical representation and biological meaning of parameters from the analysis of the microvascular angioarchitecture of the murine brain cortex. (A) Regression line obtained from partially reconstituted microvascular angioarchitectures of 11 z-stacks acquired from prefrontal cortex samples of four wt animals. Data are shown as signal amount (Vol %) versus signal dispersion (nHv 95%) plot with points reporting the analytical values obtained (6 points × 11 stacks); dotted lines indicate 95% confidence intervals. (B) Schematic representation of the experimental results shown in panel A. The parameters obtained from the regression line are indicated by letters a to g, and their biological significance is summarized in panel C. The table also reports the meaning for the low or high values for each parameter. See text for further details.

