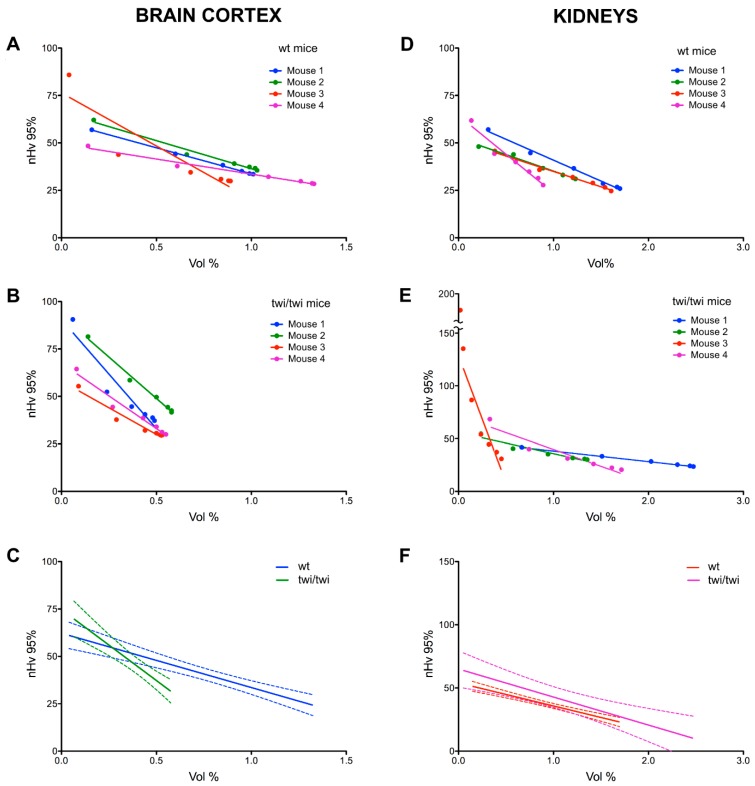
Figure 4.
Analysis of brain cortex and renal microvascular angioarchitectures in wt and twitcher mice. Regression lines obtained from microvascular angioarchitectures of brain cortex (A,B) and kidneys (D,E) of four wt (A,D) and four twitcher (B,E) mice (one to four z-stacks per animal). Panels (C,F) report the median regression lines together with their 95% confidence interval.

