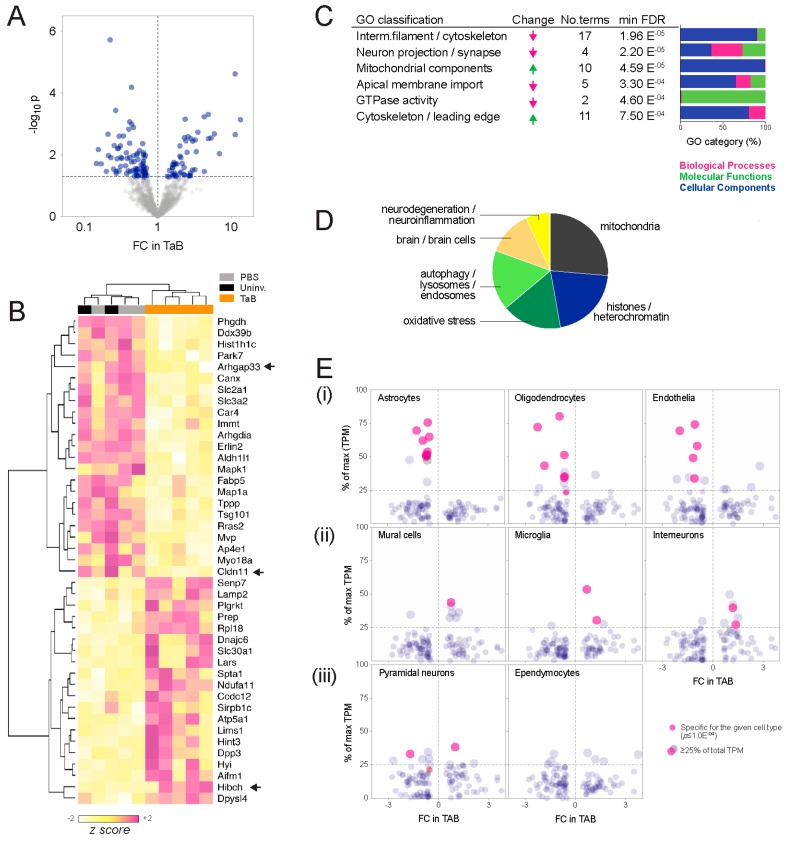
Figure 2.
Brain proteomic landscape in the MDA-MB-231 intracranial xenograft model. (A) Volcano plot showing 125 differentially abundant proteins, including 50 that were significantly more abundant, and 75 less abundant in graft-associated brain tissue compared to controls (blue; p < 0.05). (B) Heatmap and cluster dendrogram showing the most statistically significant alterations (p < 0.01). Arrows indicate those selected for in situ validation. (C) Enrichment analysis summary. Six major ontology classes were over-represented by the alterations—four amongst low abundance proteins and two amongst high abundance proteins. Also shown are the number of terms collapsed into major classes, minimum false discovery rate (FDR) of terms in each, and proportions of gene ontology (GO) processes, molecular functions and cellular components driving the enrichment scores. (D) High-throughput text mining summary showing PubMed article topics associated with the protein list (FDR < 0.05). (E) Meta-analysis of associations with mouse brain cell types. Dot plots show RNA levels as a percentage of total expression for each transcript, versus the fold-change (FC) observed at the protein level in TAB tissue. For species strongly associated with particular cell types (defined as ≥25% of total expression across all types and/or a significant relationship in an ANOVA test), changes in TAB could indicate corresponding changes in abundance of that cell type. (i–iii) Cell type-specific biomarkers trending towards increases, decreases or no overall change, respectively.

