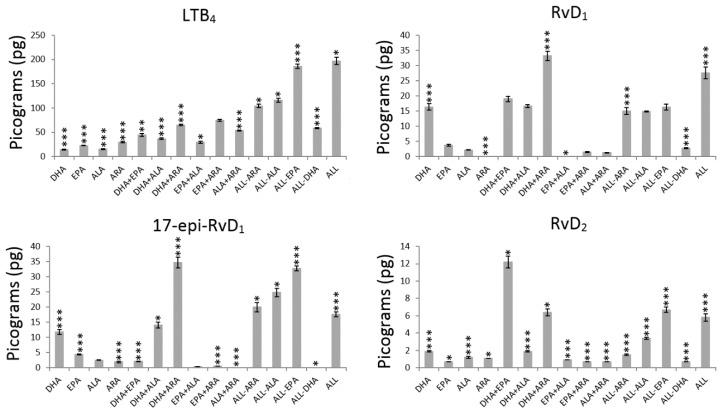
Figure 3.
Average production of leukotriene and resolvins by HUVEC exposed to different PUFA combinations. The asterisks indicate significant values at p < 0.05 (*), p < 0.001 (**) and p < 0.000 (***).The actual numerical p-values are described in Table S2.

