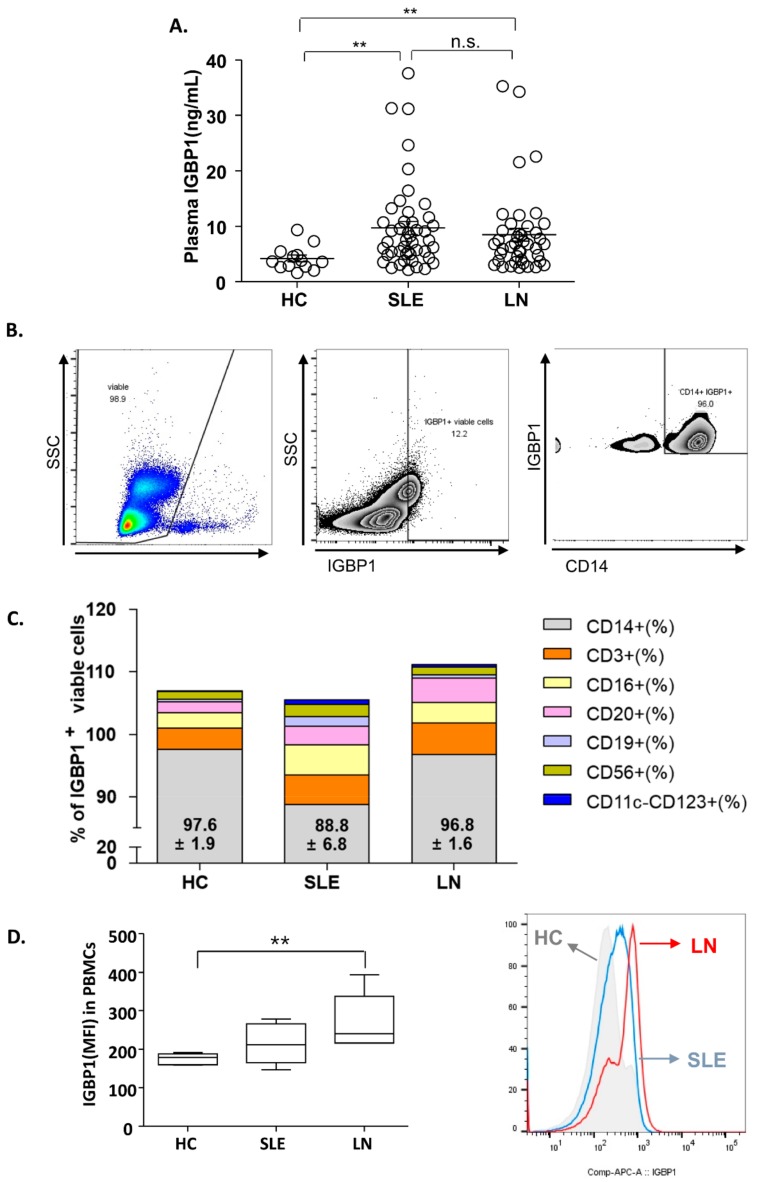
Figure 4.
Plasma IGBP1 in SLE patients and distribution of IGBP1 in peripheral blood mononuclear cells (PBMCs). (A) plasma IGBP1 level; (B) IGBP1 expression in CD14+ cells in a patient with nephritis (representative); (C) Distribution of IGBP1 expression according to cell-type; (D) overall IGBP1 intensity in PBMCs; ** p > 0.01.

