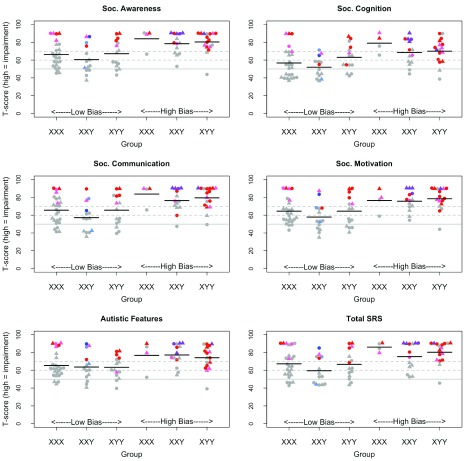
Figure 2. Beeswarm plots: Social Responsiveness Scale (SRS) scales and total T-score for the three trisomy groups, subdivided by bias group.
The horizontal lines show population mean (50, solid line), plus cutoffs of 60 and 70 (dotted lines), corresponding to mild and more severe problems. Symbol depicts age band (circle 5–10 yr, triangle 11–16 yr. Colour depicts diagnosis: grey = none; light blue = Social Phobia; dark blue = Social Phobia+PDDNOS; pink = PDDNOS; red = autism; purple = Social Phobia+autism).

