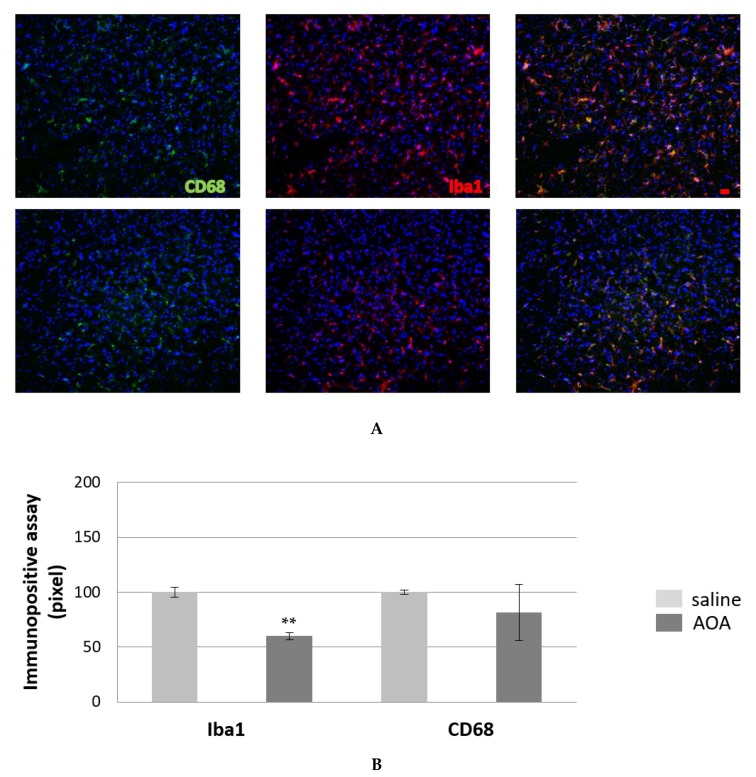
Figure 4.
Microglia (IBA1) and reactive microglia (CD68) in the spinal cord SOD1G93A treated with saline (A, upper) and AOA-treated mice (A, bottom). (B) The immunopositive assay showed a decrease of microglia in AOAA-treated mice compare to those treated with saline. The mean of the pixels was quantified in three fields of the ventral horn spinal cord in AOA-treated mice (n = 3) and saline-treated mice (n = 3). Data are presented as a percentage of normalised to saline values as the mean ± SEM. The values were compared by using Student’s t-test with **p < 0.01 (B). Scale bar = 20 microns.

