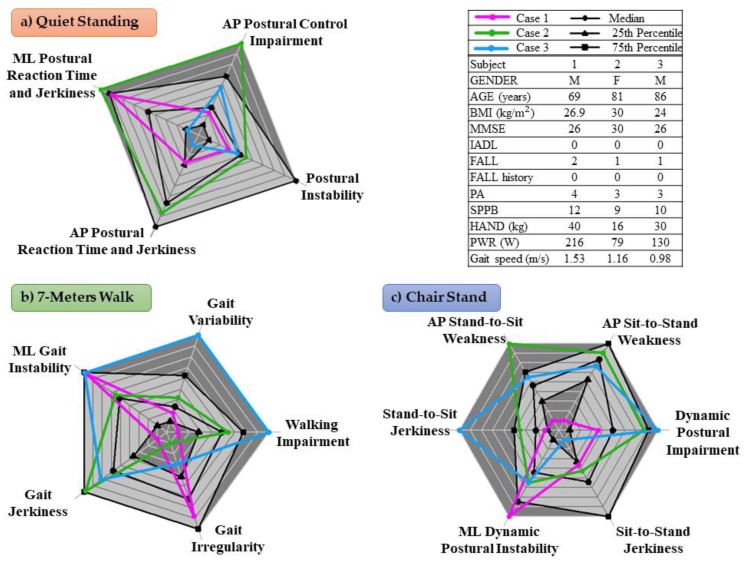
Figure 3.
Three radar plots reporting the Quiet Stand (a), 7-meters Walk (b) and 5-times Chair Stand (c) domains of three different case studies. The black lines represent the median value, the 25th and 75th percentiles of the older adults’ factor scores. The dark gray area represents extreme values (very high, above the 75th percentile, or very low, below the 25th percentile). Favorable values of the scores, below the 75th percentile, reflected good performances in the domain.

