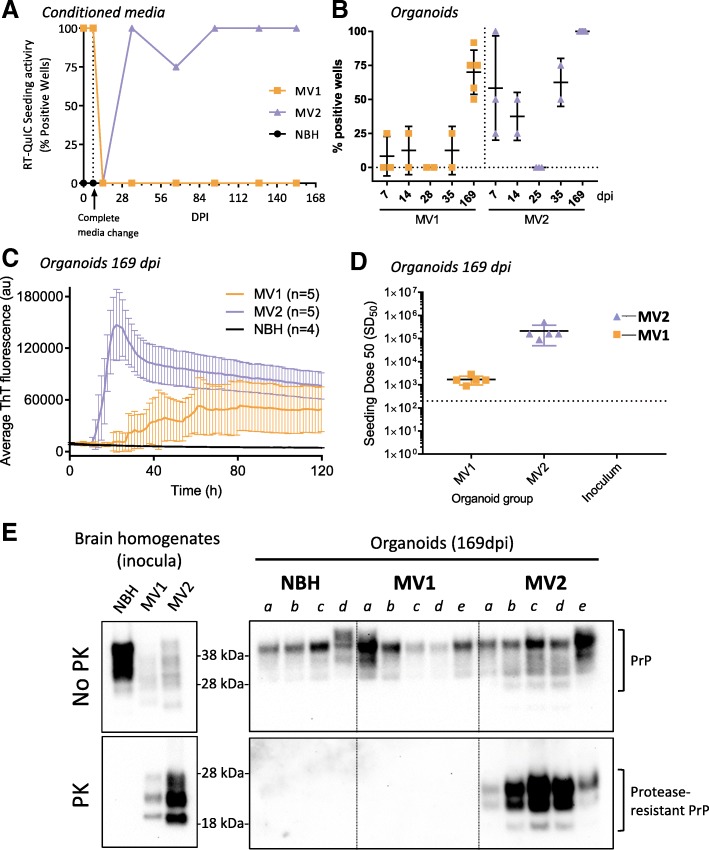
Fig. 3.
RT-QuIC seeding and protease resistant PrP analysis. a Media RT-QuIC monitoring throughout the duration of infection showing the number of replicate wells positive for seeding activity at each sampling time. Each data point represents media taken from the well containing the same three organoids in Fig. 2. Minor tick marks on the x-axis show weekly full media exchanges. b Percentage of positive RT-QuIC test wells of organoids taken at various early time points during infection and when harvested at the conclusion on the experiment (169dpi). Each data point represents an individual organoid tested in RT-QuIC with 4–12 replicate wells. Bars show mean and standard deviation of all organoids in each indicated group. c RT-QuIC seeding activity of organoid homogenates diluted 10− 3 following harvest at 169 dpi. For clarity, every other datapoint was plotted. RT-QuIC traces are displayed as averages from all organoids in each group. Error bars represent standard deviation. d SD50 values of each organoid harvested at 169 dpi and the original inoculums. Each point represents an individual organoid (or inoculum) with black lines denoting the mean and colored bars the standard deviation. The dotted line represents the threshold of detection below which results are considered negative. e Western blots showing PrP and protease-resistant PrP in the original brain homogenate inocula (left plate) and the organoids harvested at 169 dpi (right plate)

