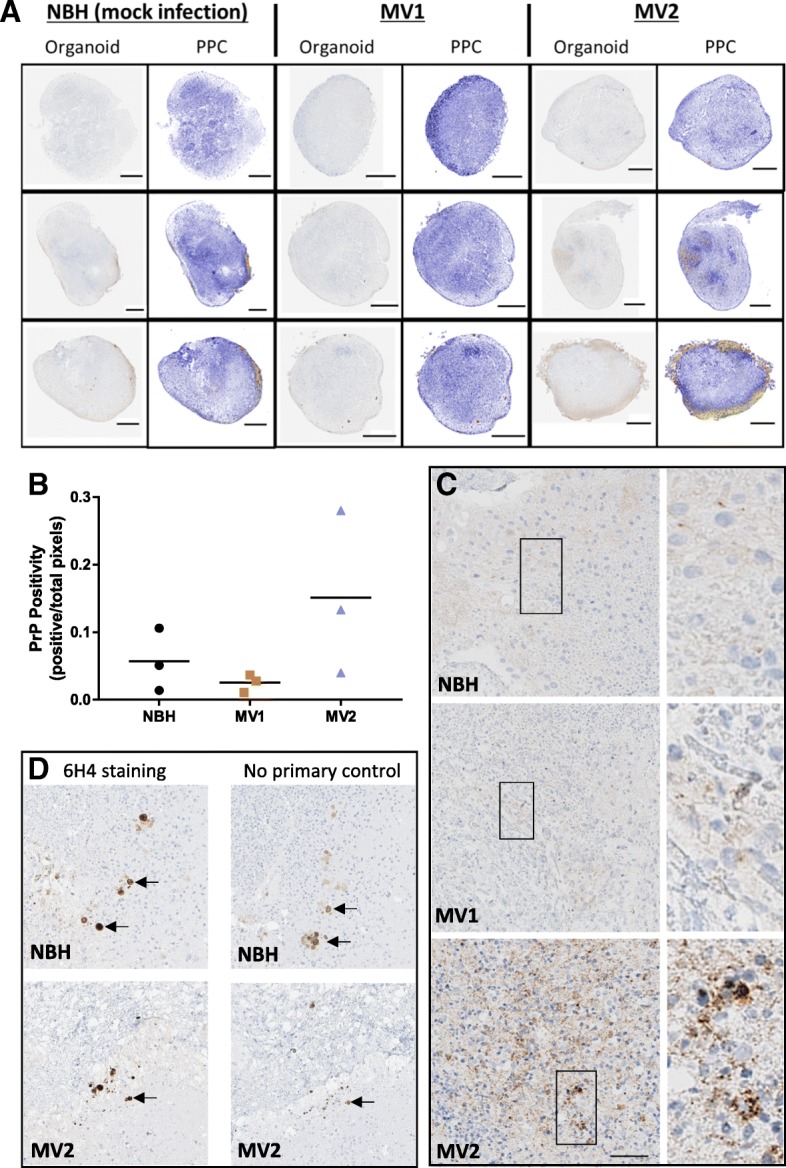
Fig. 4.

Immunohistochemical staining for PrP in organoids harvested at 169 dpi. a Whole organoid images; left panels per condition show 6H4 PrP staining (brown) and right panels showing positive pixel counts (PPC), blue signifies low and yellow-orange denotes high pixel staining intensity. Scale bars = 500 μm. b PrP positive pixel counts. Each data point represents an individual organoid with the mean indicated as a line (Kruskal-Wallis, p = 0.132). c 6H4 PrP staining of organoid interiors. Scale bar = 50 μm and applies to left panels. Right panels are zoomed images of the boxed regions. d PrP staining artifacts visible in NBH and MV2 treated organoids. Left panels show 6H4 PrP staining and right panels show no-primary antibody control stains. Arrows indicate artifacts in sequential slices. Scale is as for C
